It's all Connected
How to apply Little's Law in Software Engineering
Measuring Flow Metrics is quite simple, supports you in creating transparency about your process, and can help you spot areas for improvement. However, it’s not always obvious what can be done to improve. That’s where Little’s Law comes into play, showing that Flow Metrics influence each other. With this knowledge, we can create better experiments to improve our flow.
Read on to learn more about Little’s Law, what it is good for (and what it is not), and how we can practically apply it.
What’s Little’s Law?
Little’s Law is named after John Little, an American researcher. He was working in the field of Queueing Theory. Little’s Law is an equation, which takes the following form:
Where L is the queue length (or Work In Progress), λ is the “arrival rate”, and W is the Wait Time (or Cycle Time). While the above equation was published by Philip Morse, Little was the first to prove that the law is valid.
Kanban and Flow Metrics
When we’re applying Kanban (as defined by the Kanban Guide), we have four measures of Flow:
Work In Progress (WIP)
Throughput
Cycle Time
Work Item Age
With those four metrics, we can measure the flow of value through a system. As you can see, the original form of Little’s Law includes WIP (L) and Cycle Time (W) but not the arrival rate. However, there is another form of Little’s Law that looks at Throughput (or departure rate).
What’s Little Got To Do With It?
When we use departure instead of arrival rate, the equation looks like this:
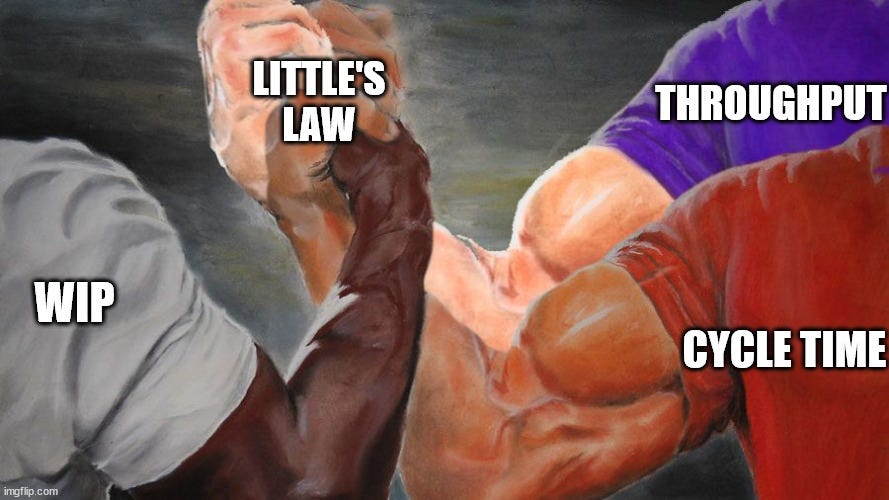
This puts three of our Flow Metrics in relation to each other, which means we cannot look at one of those three metrics in isolation but have to understand that if one changes, the other two will be affected as well. On the other hand, if we want to adjust one, we can look at how we can change one (or both) of the others to achieve the desired change.
Be Aware
Before we look in more detail at what the Law is good for and how to apply it, a few words of caution.
First and foremost, the law (especially in the form of Throughput/Departure Rate) has a set of assumptions that must be fulfilled for it to be valid. Daniel Vacanti wrote an excellent article about this if you want to dive deeper. The summary is that we expect a relatively stable system, where items that are started are also finished and we’re not accumulating more and more WIP over time.
Furthermore, the law talks about averages of the metrics over some time. In many posts that reference the law, this fact is either implied or simply skipped or forgotten. That fact makes the law not well suited for forecasting the future…
What Is It Good For?
You might be inclined to “plug in your numbers” into the equation and forecast the future. For example, you might think, that to halve your Cycle Time, you can simply half your WIP while keeping your Throughput stable.
Plans based on average, fail on average
While I understand the thought, there are several problems with it:
The law applies to historical data, not to future data.
You will not be able to tell how your Throughput is affected by this change.
The law is based on averages, so it falls victim to the Flaw of Averages
So if we can’t use it for making forecasts about the future, what is it good for?
Note: You might also realize that if you plug your historical numbers into the formula, it will not be “correct”. This is because most likely one (or more) assumptions of this form of the equation are not fulfilled. I highly recommend reading the series from Daniel Vacanti on Little’s Law for more details.
Instead of forecasting the future, we can use Little’s Law to identify improvements. It helps us formulate hypotheses and craft experiments that aim to change our Flow Metrics in a given way. The nice thing about this is, that we have the data to see if our experiments worked as we expected. We see how this could work with a concrete example, but first, let’s do a bit of elementary school math.
Solving For X
We already saw the most used form of Little’s Law above:
But we can also adjust it, so we solve it for either average Throughput or average WIP:
Depending on which Flow Metric you are most interested in adjusting, you can pick the most useful form.
A Little Less Conversation…
…a little more action, let’s dive into how we could apply this knowledge. Imagine this:
Your Product Manager approaches you and asks for support. She was checking the Flow Metrics and is concerned about the Team’s Throughput. Thus she’d like to see what could be done to increase it. She’s curious if you have concrete ideas on what could be done to improve it.
Let’s split this exercise into two parts, before we design an experiment, let’s first think about our Flow Metrics.
Impact on Flow Metrics
Let’s bring in the equation with Average Throughput on the left side of the equals sign:
The throughput depends on WIP and Cycle Time. If we want to increase our Throughput, we have the following options (in no particular order):
Decreasing Cycle Time while keeping WIP stable (or increasing)
Increase WIP while keeping Cycle Time stable (or decreasing)
Decrease WIP while decreasing Cycle Time more than you decrease WIP
Increase Cycle Time while increasing WIP more than you increase Cycle Time
Note that I skipped writing “Average” for the sake of readability.
You notice that I always wrote the change for both, Cycle Time and WIP. As a change in one will most likely affect both other metrics, I prefer writing down what I’d like to achieve for both metrics on “the right side” of the equation.
Another thing that you might be wondering about: I could increase WIP and that might lead to a positive change. But I always hear we should limit and lower WIP?
Indeed, if you can manage the effect the increased WIP has on your Cycle Time, that might be a good strategy. This could happen if you are performing below the “optimum” of your system, and have too much slack. An example could be that you are “starving” the system, so once you close an item, there is no item to be pulled, leading to wasted time for the team. An increased WIP might be useful in such a scenario.
You can see such a scenario in one of our case studies about Controlling WIP.
In any case, Little’s Law does not tell us what is “good or bad”, it just shows the relation and gives us the above options if we want to increase our Throughput. So let’s try to put this to good use.
Designing Experiments
We can now think about various ways to achieve the change in Cycle Time or WIP to increase Throughput. Let’s look at two examples:
Decreasing Cycle Time while keeping WIP stable
What the above basically means is to keep the same amount of items in progress, but get them done faster. One way to do this is to look at how you slice your items. Can they be sliced into smaller pieces? Depending on your workflow, this might lead to faster feedback, so you discover potential problems earlier (think about integration issues or early customer feedback). This in turn will support you in getting the items closed faster, in turn decreasing your Cycle Time while keeping WIP the same.
Can your Work Items be sliced into smaller pieces?
Increase WIP while keeping Cycle Time stable
If you are happy with your Cycle Time, you might consider increasing your WIP and see what happens. Whatever mechanism you use for controlling your WIP, think about allowing a bit more work into your process. Now you might not want to overdo it, and it should still be controlled, but it doesn’t mean you're not supposed to change it ever.
While the result can be an increase in Cycle Time, it might also help you achieve faster flow. The good thing is that we have the data to check this.
Evaluating your Hypothesis
Whether you call it hypothesis, improvement action, retrospective outcome, or anything else. Ultimately it’s just an assumption that when we do X —> Y will happen. We formulated our experiments based on Little’s Law, and we can very easily measure if reality matches what we hoped expected would happen.
If yes, great! You’ve successfully applied Little’s Law. You may give me a shout-out and share your experiment!
If not, great! You can see what happened instead of what you thought, and based on this either abandon or adjust your experiment. You may give me a shout-out and share your experiment and learnings!
Little’s Law is not magic, it will not solve your problems. But it can be really helpful in identifying what you could do to adjust your process and achieve a better flow.
What’s My Age Again?
The attentive reader might have noticed that we only focused on three flow metrics, but there are four of them. What about Work Item Age in all of this? Is this not relevant?
You have correctly spotted that Work Item Age (WIA) is not part of the equation of Little’s Law. However, it is of great relevance anyway. It is part of the assumptions (check the resources for more details on this). WIA is a leading indicator for Cycle Time. While Throughput and Cycle Time are lagging indicators, WIA gives us an “early warning” when items start to age. If your conclusion is that you want to decrease Cycle Time, your experiment will most likely include monitoring and acting upon aging items.
WIA is a leading indicator for Cycle Time
In my above example, I focused on slicing work items smaller as an experiment. Another option could be to set a new (lower) goal for Cycle Time, monitor the age of all the items, and start to act as soon as an item gets close to this goal (for example by swarming this item till you manage to close it).
Conclusion
Little’s Law is incredibly helpful for us if we want to design experiments to improve our flow. By knowing the different forms of the equation, we can understand what must change to achieve the result we would like to have.
If we’re designing experiments, we should be aware that both Cycle Time and Throughput are lagging indicators, while Work Item Age is a leading indicator. Moreover, we tend to have some form of control over our WIP, so this is also “simpler” to change and allows for more concrete experiments.
And don’t forget that for a proper experiment, you should observe what is happening in your process and check if you get the results you expected. And if not, you should adjust accordingly.
Resources
If you’d like to use this blog post for an interactive learning session (for example with your team), it’s available as a template on Miro.
I highly recommend reading all posts of Dan Vacanti’s series about Little’s Law, but if every minute counts, at least read:
Below are some existing Blog Posts that we wrote around Flow Metrics, the Flaw of Averages, and Controlling WIP:
Special thanks to https://imgflip.com/ for providing me with all the Meme Templates.


