
Limit Work in Progress without Work In Progress Limits
A Case Study of using Total Work Item Age as WIP Control Mechanism


A Case Study of using Total Work Item Age as WIP Control Mechanism
In the first post of this two-part series, we looked at an alternative approach to controlling Work in Progress (WIP) by using a combination of WIP and Total Work Item Age (TWIA).
In this post, we want to dive deep into the data we looked at before and during the experiment and share our conclusions from this.

Our New Approach to WIP Control
If you haven’t already read the “Part 1” post, then you really ought to do that first, before coming back here to see the data in more detail. In a nutshell, our experiment was to use a combination of Total Work Item Age and Work in Progress to assess whether new work should be pulled into our Kanban system.
Limit Work in Progress without Work In Progress Limits
Exploring Alternatives using Total Work Item Agemedium.com
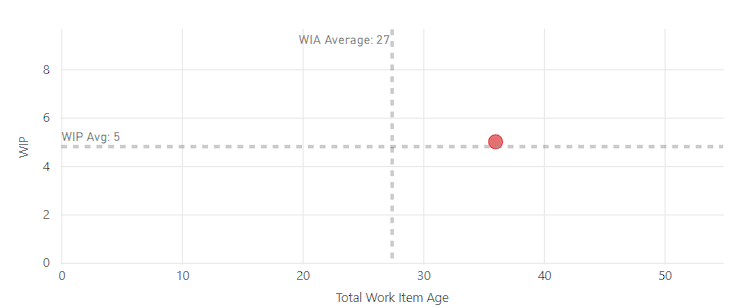
For this, we created a visualization that shows the current WIP and TWIA on a chart that also includes the averages of the WIP and TWIA from our Process Behaviour Chart (PBC) baseline.

Process Behaviour Charts (PBCs)
An understanding of PBCs is important to understand this post. If you haven’t heard of PBCs, here is a very short summary from Nick Brown.
In his post objectively track your predictability, he describes a PBC as:
“a type of graph that visualises the variation in a process over time. It consists of a running record of data points, a central line that represents the average value, and upper and lower limits (referred to as Upper Natural Process Limit — UNPL and Lower Natural Process Limit — LNPL) that define the boundaries of routine variation. A PBC can help to distinguish between common causes and exceptional causes of variation, and to assess the predictability and stability of a process.”
We highly recommend reading his post or Dan Vacanti’s Actionable Agile Metrics For Predictability Volume 2 for a better understanding of PBCs and how to use them, as well as for a better understanding of the rest of this post.
Actionable Agile Metrics for Predictability Volume II: Advanced Topics - ActionableAgile™️
by Daniel S. Vacanti The only reason to collect data is to take action. We take action because of our relentless…actionableagile.com
The Experiment
After we devised our new approach using the WIP x TWIA chart for WIP control, we wanted to try it out in practice and measure the impact.
We first aimed to be in the “lower left” quadrant, keeping WIP and TWIA low. After the experiment ran for about 4 weeks, we adjusted the approach and aimed to stay in the “upper left” quadrant. That way, we could keep age still low while increasing Throughput using an increased (or more optimized) WIP.
Little’s Law
Before going deeper into our hypothesis, let’s briefly recap the underlying law for our experiment (and in general the way we work within a Kanban system): Little’s Law.
When an Equation Isn't Equal
Little's Law is an equation that relates three basic metrics of flow. As in equal. Not approximate. But it isn't that…www.55degrees.se
This law tells us that:
Average Cycle Time = Average Work In Progress / Average Throughput
Applying some basic math you can transform this to:
Average Throughput = Average Work In Progress / Average Cycle Time
And:
Average Work In Progress = Average Throughput * Average Cycle Time
We should be aware that there are several assumptions for Little’s Law. Also, the law talks about averages, so potential changes might not be reflected right away. But if you keep your system stable over time, Little’s Law suggests that the relation between the three metrics will obey the law.
… changes will manifest themselves in ways such that the relationship among all three metrics will still obey that law. But what it does not say is that you can deterministically predict what those changes will be. — Appendix A, The Kanban Pocket Guide
Hypothesis
We hypothesized that by changing the control mechanism for WIP, we would see an increase in Throughput and a decrease in Cycle Time. We would expect to see this increase in the Throughput (sampled per week) and in the PBCs for both TWIA and Cycle Time, where we would expect it to indicate either a “large change” or at least a “moderate change” in the process:
GitHub - nbrown02/Process-Behaviour-Chart: A Power BI template that generates a Process Behaviour…
A Power BI template that generates a Process Behaviour Chart (PBC) to visualize the variability and predictablity agile…github.com
Large Changes — Any data point outside of the natural process limits (UNPL/LNPL). Unless it is something seasonal this is the key point to focus on (it’s a ‘signal’).
Moderate changes — Any data point with a run of 3 items with 2 out of any 3 consecutive points within the process limits are above the 2-sigma line.
- As described by Nick Brown on GitHub
Our Workflow
Before we dive into the data, let’s quickly dive into the team’s workflow at the time. The workflow starts with the “Refinement in Progress” stage. Once items are pulled into this stage, the items are in progress (the Cycle Time timer starts). The team members pull items in there from the “Waiting for Refinement” stage.

As soon as an item is placed in the Waiting for Refinement stage, the team may choose to pull this in and start working on this. Our Product Owner makes work available in the Waiting for Refinement Stage as soon as the process signals that we do have space. However, there could be a delay in the “WIP” as the team may not pull it in instantly. For example: An item may be put into Waiting for Refinement in the afternoon of one day, but only be pulled into Refinement in Progress the next day.
The Data
Ok, we’re finally all caught up and can check out the data from our experiment.

Baseline
As a baseline for our analysis, we look at the data from October 2023 till the beginning of February 2024. For all our PBCs, we use this as the baseline. During this time, we were using a system-wide WIP limit. The idea was that we tried to match arrival rates with departure rates. There were no significant changes in the environment the team worked on during this time.
Data
Time range: 01.10.2023–03.02.2024
PBC Baseline: 01.10.2023–03.02.2024
WIP Limiting Mechanism: System Wide — Match Arrival and Departure
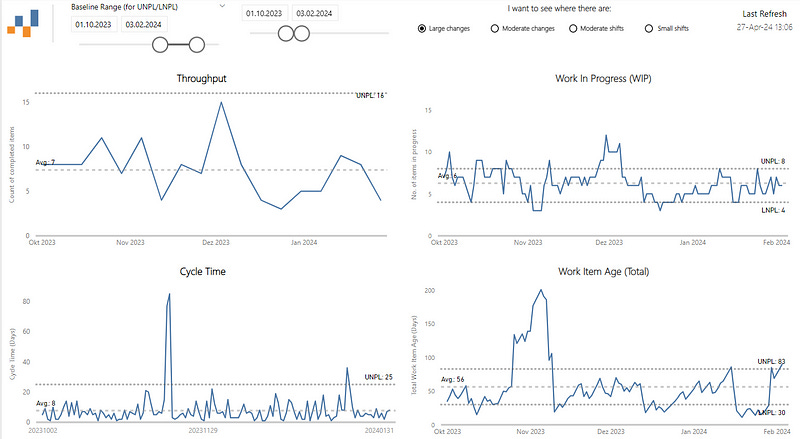
You can see that:
Throughput seems pretty predictable and hovers around the average (of 7 per week). Towards end of December there is a drop, which is explained by the Christmas break where most of the team was off for a longer period of time.
We have 3 outliers in the Cycle Time (in fact this was what caused us to think about our WIP Limiting approach)
Work Item Age was very unpredictable with values above the UNPL and below the LNPL
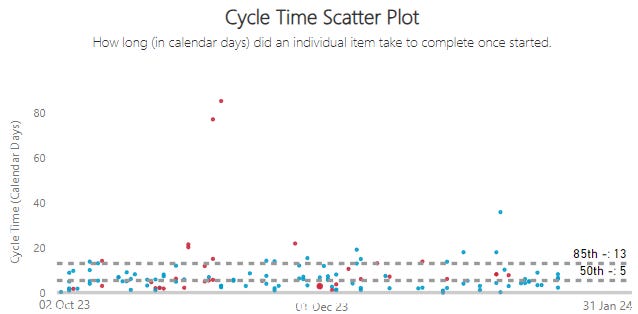
When we look just at our cycle time, we can see that we managed to close 85% of all our items in 13 days or less. Our aim (aka the “Voice of The Customer” would be 10 days or less).
So let’s see what happened when we changed our approach.
Aim for Below Average TWIA and WIP
In February of 2024, we started using our new WIP control using the Dashboard with the WIP x TWIA Chart.
Limit Work in Progress without Work In Progress Limits
Exploring Alternatives using Total Work Item Agemedium.com
We aimed to stay in the “lower left” quadrant, meaning that we were trying to get to a below-average TWIA as well as below-average Work in Progress. Every time we were above one of the averages from our PBC Baseline for either WIP or Total Work Item Age, we would not add new work. We would usually check this every time either an item left the process (aka was set to done) or when an item entered the process (whenever the team pulled something into Refinement in Progress).
Data
Time range: 03.02.2024–09.03.2024
PBC Baseline: 01.10.2023–03.02.2024
WIP Limiting Mechanism: Aim for Below Average TWIA and WIP

You can see the immediate impact this change had on the WIP as well as the Total Work Item Age. We had fewer items in progress and in general a lot less TWIA.

When we look at the Cycle Time in this period, we can also see an improvement over the baseline (although just a small) one. The 50th percentile line is still at 5 days, but the 85th percentile came down one day and is now at 12 days.

Note: The first outlier in the Cycle Time can be dismissed, it was a blocked item that was moved back to the backlog and restarted months later. The data shown is the cycle time from the first time we started that item, but in fact, after restarting it was done within 6 days.
However, when we look at the Throughput, we can see that it was trending downwards. This is not what we expected or hoped for:

It was still predictable according to our PBC, yet we were not happy with the trend we were seeing. Our feeling was that we were “underperforming” compared to before and the Throughput data was supporting this.
According to Dr. Little, if we decrease WIP more than Cycle Time, Throughput will also go down:
Average Throughput = Average Work In Progress / Average Cycle Time
So if we could keep the Cycle Time low, but increase our WIP, our Throughput should (eventually) increase again. So tweaked our approach with the hope of achieving exactly this.
Aim for Above Average WIP and Below Average TWIA
Instead of aiming for below average for WIP, we now tried to make sure we are above average (but below the UNLP). For the TWIA we still aimed to be below average. The reason is simple:
If we don’t close any items today, WIP will not go up, but TWIA will.
This allows us to be more “courageous” with WIP while being more conservative with TWIA. What we observed in the previous approach was, that our “pipeline of work” sometimes would run dry. So we were not really in the flow at all times. We hoped by having some more items in the process we could address that.
Also, we were more actively looking into the current state of the in-progress items. Are we expecting to close an old item today that will free up a “lot of space” for the TWIA? Or will we most likely not close something for a few days (for example as we’re having the weekend approaching)?
Data
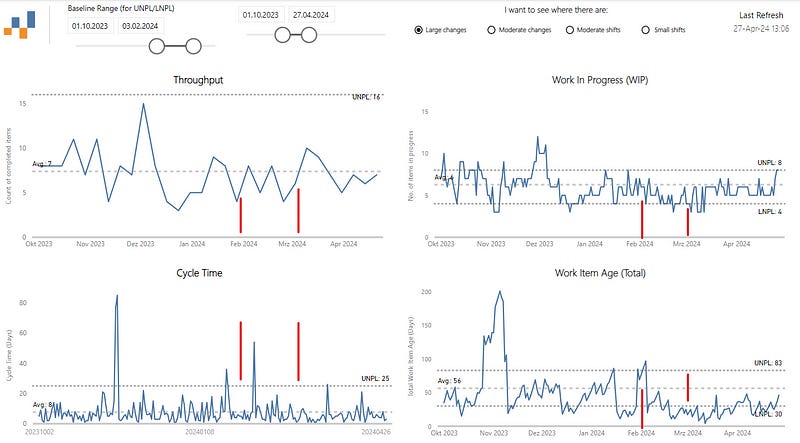
Time range: 09.03.2024–27.04.2024
PBC Baseline: 01.10.2023–03.02.2024
WIP Limiting Mechanism: Aim for Below Average TWIA and Above Average WIP

Right after the change, we saw two consecutive weeks with above average Throughput. And while it went a bit down after, we can see overall an increasing trend.

When we look at the WIP and TWIA, we can also see the impact of the change. While in February when we aimed for below-average WIP we stayed constantly under this average, starting from March we were hovering around the average more frequently. Furthermore, the Total Age trend was also going up, which makes sense as there were more items in progress:

Lastly, when we look at the Cycle Time in the time of this experiment, we can see a clear decrease. While the 85th percentile was at 13 days (baseline) and 12 days (aiming at below-average WIP), we now were at 7 days. Even the 50th percentile was down one day and was at 4 days (compared to 5 before):

A higher WIP and at the same time a lower Cycle Time should mean an increased Throughput. While we could start seeing some improvement there, it’s not yet tremendous. However, we assume that over time we will see an upward trend in Throughput if we can keep both WIP and Cycle Time stable at the current values.
Conclusion
The change in controlling WIP seems to have had an effect mostly on Cycle Time and Work Item Age for us. While our Throughput has not seen much of a change (yet), or even dropped a bit during the first approach, we’ve seen a lower WIP, lower Cycle Times, and lower Total Work Item Age.
We can also see how the Baseline for the Process Behaviour Chart changed after we changed the process:

The Throughput roughly stayed the same. The same goes for WIP. However, there is a noticeabledifference in both Cycle Time and Total Work Item Age. As Work Item Age is a leading indicator for Cycle Time, that makes sense.
Little’s Law suggests that the average Throughput will increase if we keep the average WIP at the same level and decrease our average Cycle Time.
Average Throughput = Average Work In Progress / Average Cycle Time
In the last phase of our experiment, we saw that we could increase WIP while keeping TWIA/Cycle Time low. Thus we would expect that, eventually, average Throughput will increase as well.
All in all, we are quite happy with our new approach to controlling WIP. Our process now gives us signals not only based on the pure number of items but also takes other factors into account.
Our gut tells us that this works better than what we had before, and the data at least does not seem to contradict this. We’re aware that 4 weeks of data are not that much, so we’ll be monitoring and refining our process in the coming weeks and months and see what we can learn.
About Us
We are Lorenzo (Product Owner), and Benji (Scrum Master), and have been experimenting with various ways of working for years together with our teams at Hitachi Energy. Feel free to connect with Lorenzo and me in case you want to discuss more details.
Resources & Credits
Most of the charts you can see were done using Nick Brown’s Power BI templates FlowViz and Process-Behaviour-Chart. Without Nick’s great work, which he shares for free as open-source projects on GitHub, we would not manage to capture all the data that is needed for such an analysis. If you work with Power BI, you should certainly check out Nick’s GitHub as well as his FlowViz course.
Course announcement: FlowViz Fundamentals — Nicolas Brown
FlowViz is a free data visualisation template for Power BI that allows you to better visualize flow metrics from the…www.nicolasbrown.co.uk
GitHub — nbrown02/Process-Behaviour-Chart: A Power BI template that generates a Process Behaviour…
A Power BI template that generates a Process Behaviour Chart (PBC) to visualize the variability and predictablity agile…github.com
Thanks go out also to all the people in the ProKanban.or Slack Channel who were involved in the discussion about this approach. After having “one of those crazy ideas” it helped to write it down and have a place to discuss it within the community. If you are not yet on the Slack channel, go for it now.
Last but not least, if you want to learn more about Process Behavior Charts, we highly recommend reading Actionable Agile Metrics for Predictability Volume 2 by Dan Vacanti:
Actionable Agile Metrics for Predictability: Advanced T…
Read reviews from the world’s largest community for readers. The only reason to collect data is to take action. We take…www.goodreads.com