
Running Monte Carlo Simulations in Azure DevOps

Kanban, Flow Metrics and its related practices become increasingly popular. Azure DevOps does not support all of those metrics and practices out of the box. I’ve already written about how to visualize Work Item Age if you are working in an Azure DevOps environment. Another valuable practice from the “Flow Toolbox” is to run forecasts based on Monte Carlo (MC) simulations. This allows you to predict either how long it will take to finish a certain set of items (when) or to get a prediction on how many items you manage in a given timeframe (how many).

Introduction to MC Simulations
Before we dive deeper into how to run MC Simulations on Azure DevOps, let’s quickly cover the basics. In case you’ve never heard about them before, the following section will give a quick introduction to the topic.
What is an MC Simulation?
Wikipedia describes the Monte Carlo Method as follows
Monte Carlo methods, or Monte Carlo experiments, are a broad class of computational algorithms that rely on repeated random sampling to obtain numerical results. The underlying concept is to use randomness to solve problems that might be deterministic in principle — Wikipedia
To forecast, we try to “simulate” the past and apply it to the future. We run many of those simulations and see what is “most likely” to happen.

A simplified version of the algorithm to forecast the next five days based on the previous two weeks would look like this:
Create a run chart of your throughput per day for every day in the last two weeks (e.g. Monday: 2 items done, Tuesday 1 item done, etc.)
Randomly select five days on this chart and sum up the throughput → This is the simulated throughput for this week. Put the result on a histogram
Execute step two many times (like 10'000+ times)
On your histogram, find the throughput value that 85% of all simulations showed you would achieve (greater or equal than) → this is your 85th percentile
The value at your 85th percentile means that in 85% of all simulations you managed to get that many items done in five days. That can be your forecast. You can also use the 95th percentile if you want to be more certain.

If you want to learn more, I recommend reading up on it on the Actionable Agile Blog or checking out the Drunk Agile Youtube Channel.
Why Run MC Simulations?
Back when I started in software development, work was usually estimated in hours. That works ok as long as the task is small, but the bigger (and more complex) it is, the harder it becomes to get a meaningful estimate.
Later on, we moved to Story Points. While they are useful for having a conversation and aligning on understanding, they are not suited for predicting how long something will take or when things will be done.
MC Simulations can help us with predicting those two things:
How long will it take to complete a certain amount of items
How many items will we be able to complete by a certain date

Furthermore, you can rerun the simulation as soon as something changes. Meaning that you can update your forecast as frequently as you want. All of this without having to spend time in estimation meetings with your team. Pretty cool!
Prerequisites to Running MC Simulations
Less (or no) time is needed for estimation, but you get frequent updates on your forecast. There has to be a catch, right? Well not really.
All you need is to know when your items were done so that you can create a throughput run chart. No need for a specific tool, this can be done by hand or with any Spreadsheet tool.

Knowing throughput and how it relates to other flow metrics for sure helps. And while we don’t need to estimate items, it’s good to have them “right-sized”. The better your flow is, the better the forecasts will be. But you can most likely get started right away.
MC Simulations on Azure DevOps
Let’s get to the interesting part — how can you run MC Simulations when your data is on Azure DevOps? As mentioned you can do it manually if you want to, but that has some downsides. For example, somebody has to do collect the data everytime you want to forecast. So instead, let’s focus on an automated way to do it.
External Tools
You can use external tools for running an MC Simulation. A popular one is Actionable Agile which supports both “How Many” and “When” simulations and hooks in nicely with Azure DevOps.

Another option could be to use FlowViz. This Power BI template connects to your Azure DevOps and visualizes flow metrics and has the option to forecast both “When” and “How many”.

While Actionable Agile will require a license (after a 30 day trial), you can use FlowViz for free (but you’ll need Power BI for it). Both those tools work well if you want to check the forecast every once in a while. However, we were looking for a way to continuously update our forecast. So we found another way.
Custom Script
We created a script (in Python) that we can run continuously. You can find a version of it on GitHub and use it yourself.
You can use the script to forecast both how many items can be done till a certain date, as well as when a certain amount of items will be done (the “remaining items” are calculated based on how many items with a certain tag are not done yet).

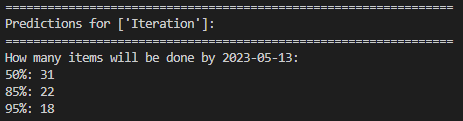
The script will fetch all the necessary data from Azure DevOps. Then it will create a throughput run chart and runs an MC simulation based on this. The results look like this:

Moreover, the script can forecast an iteration. “How Many” will provide you with the number of items that can be done in the next iteration (the number of days per iteration can be passed as a parameter). As well you can run a “When” forecast based on a specific tag (like “Sprint Goal”).
If you use Scrum, this can help foster conversations in dailies (“based on the forecast we won’t manage what we initially planned”) and serve as input for a planning (“this is how many items we should normally manage within one iteration”).
Continuous Forecasting
The beauty of such a script is that it allows you to continually run it. In our case, we run it nightly and update our forecasts, which we then visualize in Power BI.

If you are using continuous forecasting, it is important to check this data also continuously. Forecasts help you take action early, they are a tool to build trust with your stakeholders. If you have this at your disposal, you should make use of it.
Conclusion
MC Simulations can help you answer two questions:
How much can we get done till date X?
When will X number of items be done?
There are different methods to run MC Simulations if your items are on Azure DevOps. You can use external tools such as Actionable Agile or FlowViz, or create your own tool. A sample script that you can use is available on GitHub.
By using a script, you are enabled to continuously forecast. This allows you to take action as soon as something changes (which happens rather often if you work in a complex environment).