
How to Visualize Work Item Age in Azure DevOps

Flow metrics are an essential part of teams that want to focus on flow. Work Item Age is a key metric, as teams should prevent items from aging unnecessarily. Visualizing Work Item Age can support the teams to take action as soon as something grows older than usual.
However, Azure DevOps does not provide a way to visualize Work Item Age out of the box. In this article, I’ll share several methods we’ve tried already to visualize it anyhow. I’ll share the pros and cons of each method and provide recommendations for selecting the approach that best suits your context.
But first, let’s start with why we even care that much about Work Item Age.
Why Work Item Age?
According to the Kanban Guide, Work Item Age is “The amount of elapsed time between when a work item started and the current time.”.
If you are interested in flow, Work Item Age is a key metric you should be concerned about.
Age is by far the most important of all the flow metrics to track. — C. Johnson, D. Vacanti, P. Singh, The Kanban Pocket Guide
The reason why it’s so important is also described nicely described in the same book:
Allowing items to arbitrarily age is the single greatest factor as to why you are not efficient, effective, nor predictable at delivering customer value. […] the single most important aspect that you should be paying attention to is not letting work items age unnecessarily! — C. Johnson, D. Vacanti, P. Singh, The Kanban Pocket Guide

Control the age of your work items, and you’ll better control the flow. Work in Progress will be limited automatically if you focus on the age of the work items and actively try to prevent them from getting too old.
Why Visualize It?
Ok, it’s important, but why do we want to visualize it? Making this metric transparent will help the team have meaningful discussions. The point is not to track the number and never look at it. It should be inspected frequently, and the team should discuss and take action if an item grows too old. Actions could be that we
actively try to unblock it
find other ways of solving a problem if something takes too long
split the item up into multiple items and finish one part of it
whatever else that might make sense in your context
Visualization helps us to see the age of the items right away. If it’s hidden in some spreadsheet somewhere that nobody looks at, I guess that the discussions are not happening. Or they happen, but they happen too late.

Work Item Age on Azure DevOps
State today (2023–03–18), Azure DevOps does not allow you to visualize Work Item Age easily. While you can customize your boards and nicely visualize your workflow, getting the age and then visualizing it is not supported out of the box.
We’ve tried (and still use) several different methods to do so. I want to share what we’ve tried so far. Be aware that all those methods have pros and cons and that it depends on your context and which approach makes the most sense. If you are aware of another way to visualize Work Item Age please let me know.
Actionable Agile
Actionable Agile (AA) is available as an extension for Azure DevOps. While you can install the extension for free, every user needs a license to be able to use it. I’d consider this the tool for all things related to flow metrics. From cycle time scatter plots, Cumulative Flow Diagrams to Monte Carlo simulations, AA can about anything you want a tool to do.
However, this might also make it a bit difficult to use at first. One might be overwhelmed with all the options. It has a trial license so you can check it out for some time, otherwise, you can use the Live Demo and check it out.

AA integrates nicely with Azure DevOps, meaning that it will automatically load the data from your configured teams and offers all the charts you could wish for. But in case you want to have your regular board augmented with data from AA, this is not possible according to my knowledge.
Pro
Very Powerful, the tool for all things related to flow metrics
Loads data straight from Azure DevOps
Integrates as Extension in your ADO instance
30-Day Trial & Live Demo available
Con
If you want to use it, you need a license (so all team members would need to have a license if they want to see the Work Item Age)
Does not integrate with the Board of Azure DevOps (data only available in dedicated AA view)
Might be overwhelming/too complicated if just used for Work Item Age
Installation of Extension requires Organization Administrator rights
FlowViz Power BI Template
If you are using Azure DevOps, chances are that you have access to other Microsoft tools as part of your Subscription. If you have access to Power BI, you can make use of the FlowViz Power BI Template.
This template allows you to easily connect to an Azure DevOps team project and show different charts related to the flow of your team.

While you have limited possibility to adjust the charts compared to Actionable Agile, it contains a lot of useful information. Furthermore, it’s easy to get started:
Download the template file
Execute it in Power BI
Enter your data in the Wizard
You’re all set
The downside is, similar to AA you cannot integrate this data into your Azure DevOps board. But the charts can be made accessible to everyone on your team without the need for a special license.
Pro
Free
Easy to get started with Flow Metrics (if you don’t want to invest in Actionable Agile right away)
Easy Setup
No need for Organization Administrator rights
Con
Requires Power BI
No integration with your Boards
Limited functionality compared to Actionable Agile
Not easy to adjust
Styling Rule Based on “State-Changed” Date
Besides external tools and services, you can also use integrated functionality from Azure DevOps. One very simple way to do so is to make use of the styling rules on your board.
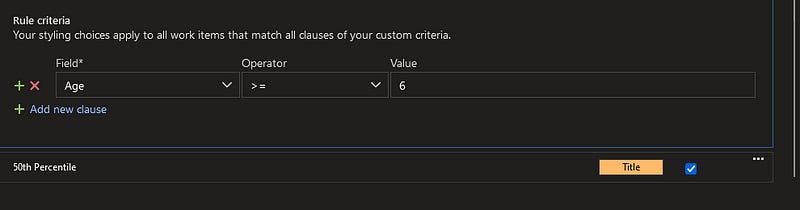
You can use the “@Today” syntax to color an item a certain number of days after its state has changed. You can also have multiple rules, for example, to indicate when an item hit’s your 50th percentile and when it’s at your 85th percentile.

The nice thing about this approach is its simplicity. You can set this up within a few minutes and it’s visible directly on your board. For everyone. This would make it difficult to not talk about an item growing too old.
While the approach is simple, it does have some drawbacks. If the rule is based on the “State Changed Date”, it’s easily “reset” by changing the state. This also means you might not be able to apply it across your full workflow, but only certain parts. For example for a certain number of columns on your workflow, but not all of them.

Pro
Integrates with your Board and is instantly visible
Easy to add, configure and adjust
No admin rights needed
Con
Limited control (based on states)
Not very flexible
Might not cover your full workflow
Custom Field and Script
Last but not least, you can calculate the age as part of a custom script. Azure DevOps has a very powerful API that makes it easy to do so.
A script can:
Check the items currently in progress
Figure out when they were started according to your definition (e.g. when did the state change or when was it pulled into a specific column)
Calculate the age based on the following formula:
(Today — Start Date) + 1

Once you have the age, you can update this to a field of the item on Azure DevOps. You might use a custom field or something existing if you have anything that fits.

This field can then also be made visible on the cards on the board via the settings:

Now we can see the age at first glance:

Lastly, we could apply some styling as in the previous example to indicate with colors when we reached our 50th and 85th percentile:
And voilà, we have a nice visualization of our Work Item Age on our board:
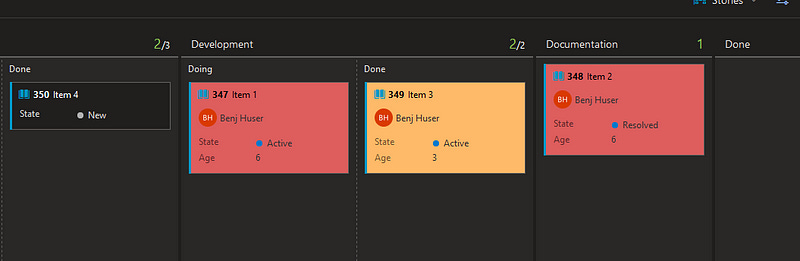
Note the difference to the previous styling rule based on the state changed date: We now have the coloring independently from the column or state.
The last thing you should do now is to make sure your script runs frequently (if you measure your age in days, running it once per day seems reasonable). You can do this for example by running it as part of an Azure Pipeline that is triggered nightly.
Pro
Customizable to your needs
Integrates nicely with your Board
You can see the current age and have a visual indicator
Covers your entire workflow
Con
Needs some scripting knowledge
Ideally, you have a dedicated “age” field (requires an organization admin to adjust your template)
Note: To counter the “Scripting Knowledge” gap that some might have, I’ve created a sample Python script that you can use and adjust as you wish. You can find it on GitHub.
Feel free to reach out to me if you struggle with setting it up.
Conclusion
I’ve shown various ways how you can visualize your Work Item Age when your data is in Azure DevOps. We’ve tried them all and have all of them in use within various teams. Which option makes the most sense for you depends on your context and what you want to achieve.
Do you want to dive deep into your flow metrics? Spend the money and go for Actionable Agile
Do you want to have a soft introduction to flow metrics with your team? Try out the FlowViz Power BI template and see if it’s useful for you
Do you want a very simple way of highlighting items that age within a specific state? Use styling rules based on the state-changed date
Do you want to track Work Item Age across your full workflow and visualize it nicely within your board? Get your coding hat on and integrate that script
Do you know other ways to visualize Work Item Age on Azure DevOps? If so, please let me know and I can update the post.
Hi Benji! Thanks for the article! I would be grateful for a more detailed description of the custom script approach. I currently used custom field and power automate to calculate work item age - inspired by Nick Brown's article on Medium.