

Lighthouse ships a new release almost every week, and it's easy to miss what's in them. So once a month we'll put the highlights on display. This is the first one, covering everything from early September until today.
Refinement, without the guesswork
Your team refines for an hour every week, starting at the top of the backlog and stopping when the time runs out. Some weeks that leaves the team short of ready work. Other weeks it builds a pile of refined items that sit around and go stale.
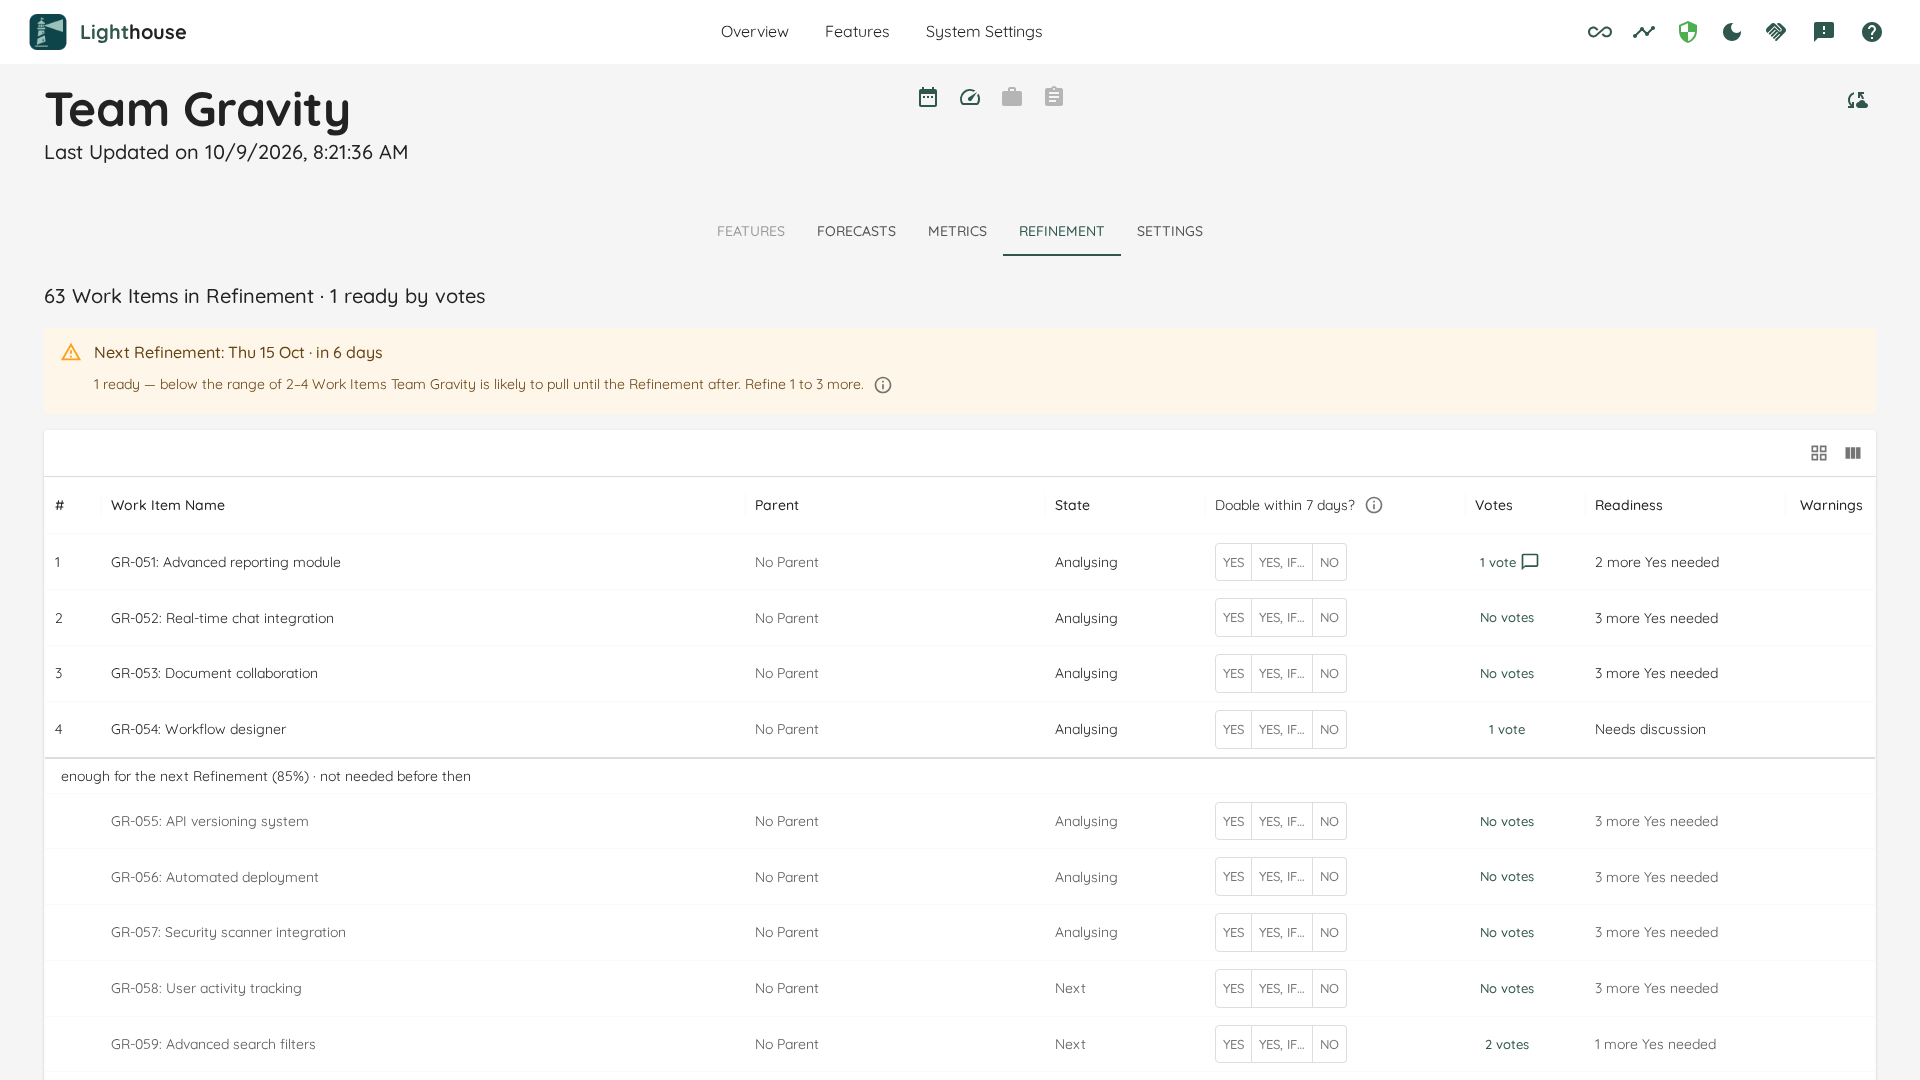
Every team in Lighthouse now has a Refinement tab, which answers two questions before your next session.
How much should we refine? Give the team its refinement cadence. Lighthouse compares how many items are ready with how many the team is likely to pull before the refinement after next, using the same How Many forecast you already know. You get one of three answers: refine 2 to 5 more, nothing more is needed, or stop refining. The items needed first are numbered, and a line shows where "enough" ends. Having too much ready gets flagged just as clearly as having too little.
Is this item small enough? Instead of estimating, everybody answers one question: is this doable within our SLE? The answers are Yes, Yes, if… (with the condition written down), or No. People can vote any time, without a meeting, and enough Yes votes make an item Ready.
Try it: update to v26.10.10.1 or later and open a team's Refinement tab. It's included in every installation, Community and Premium. How it works: Refinement and Refinement settings.
See how your delivery gets there
Your stakeholder doesn't only want to know when the delivery will be done. They want to know which features get worked on first, which ones wait behind them, and whether the last one still lands before the target date if things go less well.
Open a delivery and go to its new Timeline tab. You get one bar per feature, in board order, running from the day work on it is forecast to begin to the day it is forecast to finish. Switch between 70%, 85% and 95% and every bar moves with it. Switching to 95% and checking whether the last bar still lands before your target date is the quickest way to see how much slack you really have. You can also colour the bars by status (which features finish after the target date, or won't even have started by then), split them by team, or show warnings right on the bar.

Behind it, there's a new Forecasted Start column next to the completion forecast, everywhere features are listed. A start date far in the future tells you about the queue: nothing starts until the teams are free of everything ordered above it. You can write the start dates back to Jira and Azure DevOps, so the plans in your tracker show both ends of every feature.
Try it: v26.9.24.6 or later. The Timeline is a Premium feature; Forecasted Start is free. How it works: Delivery Timeline and Forecasted Start.
Also new
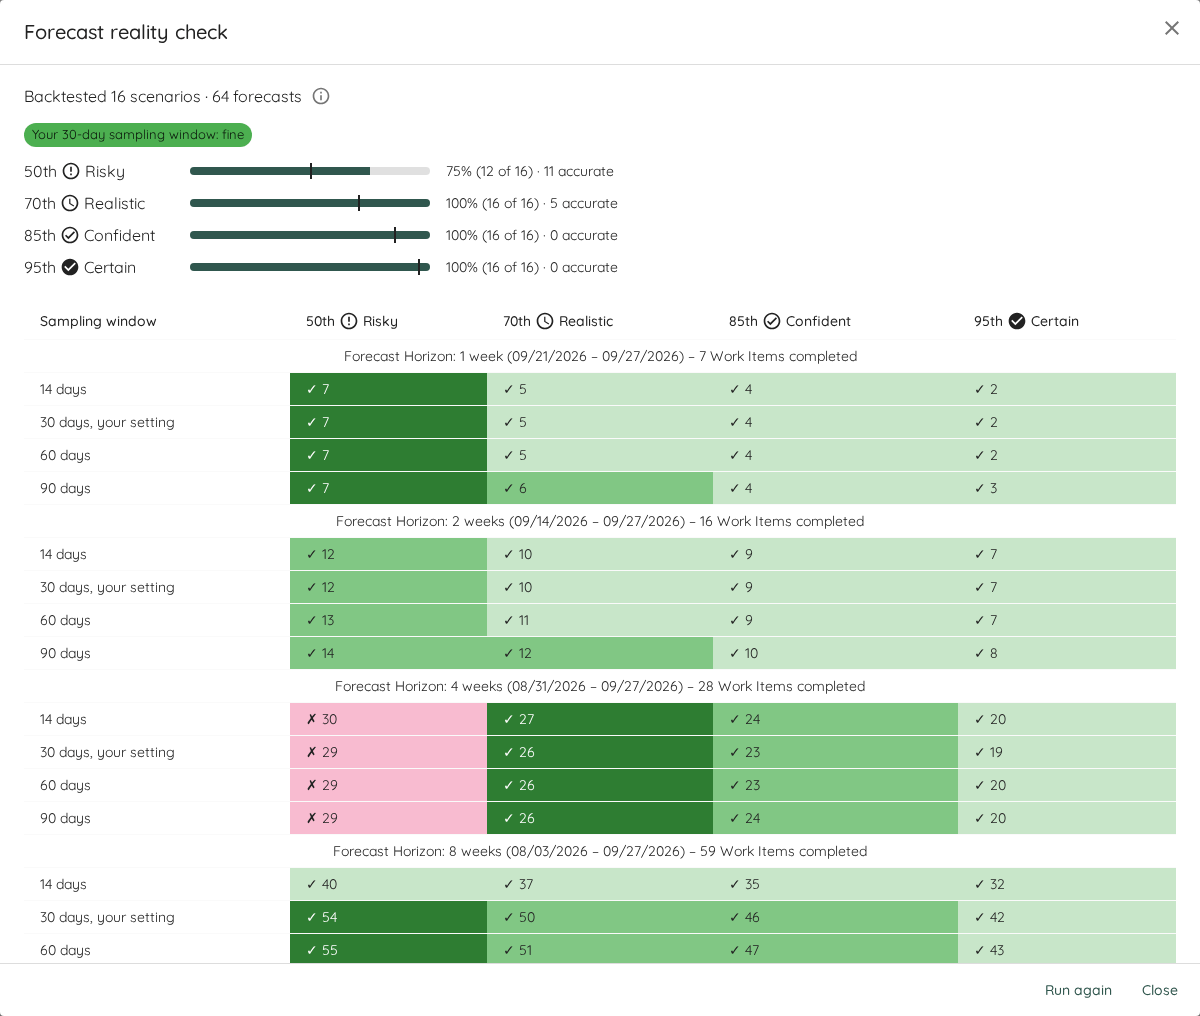
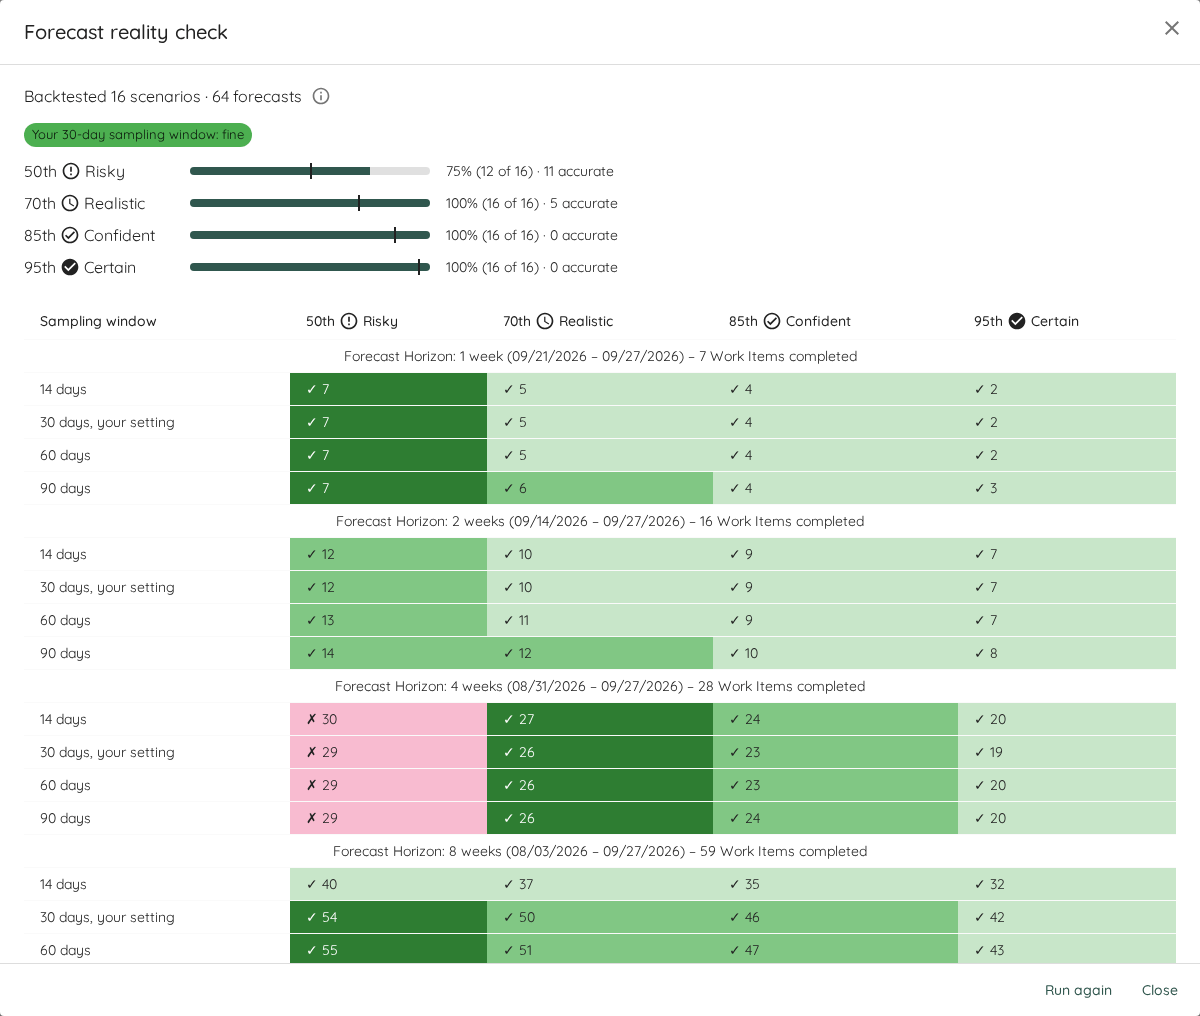
Find out whether your forecasts actually hold. Press Run Reality Check on a team's Forecasts tab and Lighthouse replays the team's recent forecasts against what was actually completed. It tells you whether your sampling window works and how often each confidence level held. Forecast Reality Check, v26.10.3.6 (docs)
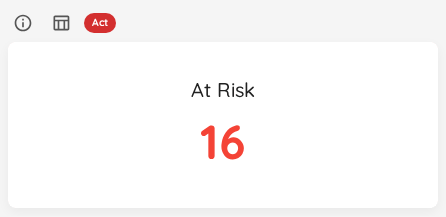
Forecast Reality Check See which items in progress are likely to miss your SLE. Every in-progress item now shows its chance of finishing later than the team's SLE, based on the team's own history, and a new widget lists the items at risk. SLE Risk, v26.9.19.10 (docs)
The SLE risk widget Compare one period with the next in one click. Pick a named range (the last 7, 14, 30 or 90 days) and step the window back and forward with the arrows. Named time ranges, v26.9.9.9 (docs)
Let your AI assistant prepare refinement and the daily. Two new agent skills: Refinement ("Are we ready for Thursday's refinement?") and Daily Flow Review ("What should our team discuss today?"). Both grew out of ideas from Liz Rettig. Agent skills, v26.10.10.1 (docs)

What else happened?
While Lighthouse is our core business, there are other things going on in parallel. We get that you can’t make it to every event or see all our posts, so here is the summary:
Lighthouse Live: Let People Behind the Scenes (28 September). We showed how our two-person company actually works with AI: how we make decisions each week, how we use agents to build Lighthouse, and where it doesn't work. Watch the recording.
Lighthouse in 75 seconds. A new short video on what Lighthouse does: flow metrics and forecasts you can defend. Handy to send to a colleague who asks what this tool is. Watch it.
Coming up
Monday 19 October, 16:00 CET: Planning SAFely with Agnieszka Reginek. Using flow metrics and probabilistic forecasting for quarterly and PI plans you can stand behind. Sign up
Wednesday 4 November, 17:00 CET: Beyond Burnups with Nick Brown. Why burnups mislead, and what probabilistic forecasting does better. One attendee wins a copy of Nick's new book. Sign up
Tell us what you think
This post is an experiment. Hit reply and tell us what you'd like to see next, or what you're still missing in Lighthouse. We read every answer.
Benjamin and Peter
Stay in touch
Slack: questions, ideas, and help from other Lighthouse users in our community Slack.
Meetup: join Lighthouse Live so you never miss a session.
LinkedIn: follow LetPeopleWork for the small news in between.
Lighthouse Premium: running more than three teams or a portfolio, or want forecasts written back to Jira or Azure DevOps? See what Premium adds.