
Limit Work in Progress without Work In Progress Limits
Exploring Alternatives using Total Work Item Age


Exploring Alternatives using Total Work Item Age
Are Work In Progress (WIP) Limits the only way of controlling the volume of in-progress work? After reading Daniel Vacanti’s Actionable Agile Metrics For Predictability Volume 2 (AAMFP 2), and a conversation on the ProKanban.org Slack Channel, we started experimenting with using Total Work Item Age to control WIP.

This post is part of a two-part series. In this first post, we look at what we’ve explored. In the second post, we look at the data and assess how well it worked based on the data we’ve collected.
Limit Work in Progress without Work In Progress Limits
A Case Study of using Total Work Item Age as WIP Control Mechanismmedium.com
Controlling Work In Progress
Let’s start with the basics, why do we we even care about limiting work in progress? Simply put, when we work on too many things, work tends to not flow as well as it could. The more we have in progress, the less focus we have. This then often leads to having many things started but not so much ever finishing. Ultimately, making sure WIP is not too high will help us achieve a higher Throughput because we focus on what’s already in progress and see it through till it’s done.
Unlocking Real Impact: An Introduction to Little’s Law (#1 in Series)
While preparing for the PKT license I took a deep dive into the famous Little’s Law. I was surprised by the wealth of…medium.com
WIP Limits
Interestingly, although the Kanban Guide states that “system members must control WIP from start to finish”, it doesn’t mandate a mechanism for doing this. It does add that typically WIP limits are used, as well as clarifying that there are various ways to manage these WIP Limits.
Kanban system members must explicitly control the number of work items in a workflow from start to finish. That control is usually represented as numbers or slots/tokens on a Kanban board that are called WIP limits.
— The Kanban Guide
You can limit WIP per column, for the full system, or any other way that makes sense in your context. Other examples include matching arrivals and departures of your system (which essentially will lead to a system-wide WIP) or using something like Drum-Buffer-Rope (DBR) scheduling.
However, WIP limits might not be the only way to limit WIP. It’s important to control WIP somehow, whether you do this solely by counting the number of items in your process or not.
An often overlooked point is that WIP limits should not only be an upper limit, but an optimum.
It’s one thing that the overwhelming majority of flow practitioners get wrong and that is thinking that a wip limit is an upper limit. A wip limit should represent a system’s capacity which means being under a wip limit is just as bad as being over the limit. — Dan Vacanti via ProKanban.org Slack Channel
Let’s assume we have a system-wide WIP limit of 5 items. That means that 5 would be the optimum. With 5 items, the system performs the most efficient and effective. We should not have 6 or more items in progress. But also we should not have less than 5 items, as this would mean we’re “wasting” capacity of this system.
Controlling the Age of Work Items
To actively manage the items in a workflow, it’s considered good practice to ensure that items don’t age unnecessarily. That’s in line with the often-heard statement “Stop Starting, Start Finishing”. In other words, you may say that within a Kanban system, pulling work into your workflow is a commitment to finishing it.
Stop Starting, Start Finishing
To achieve this, you want to make sure your items don’t age unnecessarily. This is often done by using the Work Item Age measure. For example, can we use a daily meeting to focus on the oldest item(s) and discuss how we can get them moving (instead of focusing on what each person does)?
Combining Age and WIP Limits
We’ve been using system-wide WIP limits for a while, and also we wanted to focus on the age of in-progress items. However, we were seeing that sometimes we get a signal from the system that we should start more work (remember that the WIP limit is the optimum, not just an upper boundary) while we had an item that was aging for quite some time already.
Mixed Signals
Let’s assume a fictional scenario to show where we might get different signals from our process:
You have a system-wide WIP Limit of 4 items
You just finished one item, meaning that the WIP Limit is telling you to start more work
The remaining 3 items are aging towards/beyond the team Service Level Expectation

In that case, you know would have two “conflicting” signals:
One that tells you to start more work
Another that tells you to focus on the aging items
To counter this potential conflict, we started looking into using Total Work Item Age together with WIP Limits as a mechanism for controlling our WIP.
Total Work Item Age
Total Work Item Age (TWIA) is a measure we learned about when reading AAMFP 2:
Total Age is simply the sum of the Ages of all items that are in progress for
a given time period (most likely per day). For example, let’s say you have 4 items currently in progress. The first item’s Age is 12 days. The second item’s Age is 2 days. The third’s is 6 days, and the fourth’s is 1 day. The Total Age for your process would be 12 + 2 + 6 + 1 = 21 days. — AAMFP 2 by Daniel Vacanti, credited to Prateek Singh
When it comes to controlling WIP, TWIA might be a viable alternative:
Personally, I believe, if well understood, [TWIA] is a more powerful mechanism than WiP limits — Prateek Singh via ProKanban.org Slack
When combined with a “Process Behaviour Chart”, you can track your predictability concerning the age of your items.
Process Beaviour Charts (PBCs)
In his post objectively track your predictability, Nick Brown describes a PBC as:
“a type of graph that visualises the variation in a process over time. It consists of a running record of data points, a central line that represents the average value, and upper and lower limits (referred to as Upper Natural Process Limit — UNPL and Lower Natural Process Limit — LNPL) that define the boundaries of routine variation. A PBC can help to distinguish between common causes and exceptional causes of variation, and to assess the predictability and stability of a process.”
We highly recommend reading his post (or AAMFP Vol II) for a better understanding of PBCs and how to use them.
Objectively measuring “predictability”
How we’re helping our ASOS Tech teams objectively understand predictability whilst moving away from traditional…medium.com
One of the cool things about TWIA is that you can forecast it for the next unit(s) of time under the assumption that “nothing happens”. If you have 3 items in progress today, your TWIA will increase by 3 tomorrow if you neither start nor close any item.
Limiting WIP by taking into Account TWIA and WIP
One idea that we had was to limit Work in Progress only by looking at TWIA. We could define a limit that, if we’re under it, we should add new work to our process. Potential limits could be the average from our Total Work Item Age PBC. For example: If TWIA is below 20 days we should start new work:

In such a case, you might finish one item, but if your TWIA is still above 20 days, you should not start something new but focus on the items already in process.
But what if we finish all the items at once? We most likely don’t want to start 20 new items just because we want to get our TWIA to 20. So we concluded a combined approach of both TWIA and WIP could be a good compromise.
Combining WIP and TWIA as WIP Limiting Meachnism
So far we’ve established that:
We don’t want to rely solely on WIP to control WIP (I know that sounds strange, but it’s true)
We also don’t want to rely solely on TWIA to control WIP
We can project how much TWIA we’ll have tomorrow if nothing changes
After some discussion and drawings on a whiteboard, we concluded that:
If we don’t do anything, WIP will stay the same, but TWIA will always increase. In other words, Total Work Item Age will get “worse” by doing nothing, and WIP will not (unless you have 0 things in progress. But 0 is not an optimal WIP limit).
We aim to “hover” around the average of our PBC (both for TWIA and WIP). This means once we are below, we want to get above it, and once we’re above it, we want to get below.
We can use this information to make continuous decisions about whether we should start new work or not.
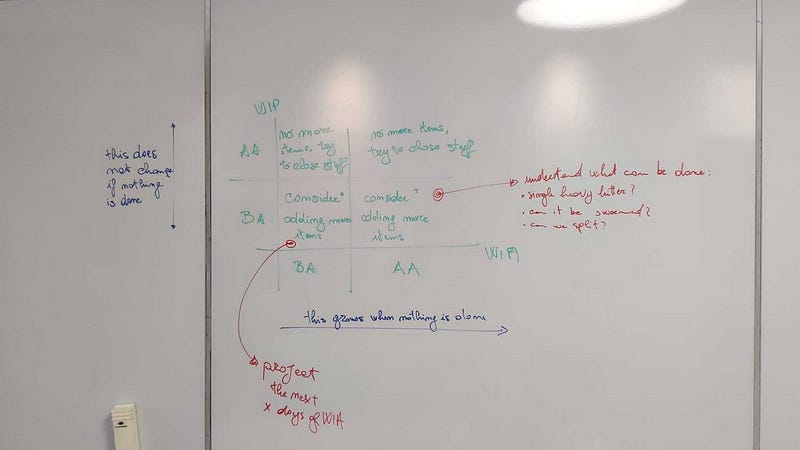
To visualize both TWIA and WIP, we created a chart where on the X-axis we can see the current TWIA, and on the Y-axis the current WIP. We also split this by the averages from the respective PBCs. This gives us 4 quadrants:
Above Average WIP & Above Average TWIA
Above Average WIP & Below Average TWIA
Below Average WIP & Below Average TWIA
Below Average WIP & Above Average TWIA
The idea of the quadrants is to signal how we are doing regarding our current Work In Progress, and depending on where we are, we will take different actions.

Dashboard
We’ve created the below dashboard with our WIP x TWIA chart, as well as other information like:
The PBC of WIP and TWIA of the last few weeks
The current TWIA split by all the items in progress
The projection of TWIA over the next 5 days
This helps us make informed decisions, taking into account the current age of all items in progress and how the total age would look in the coming days if we were to close no item.
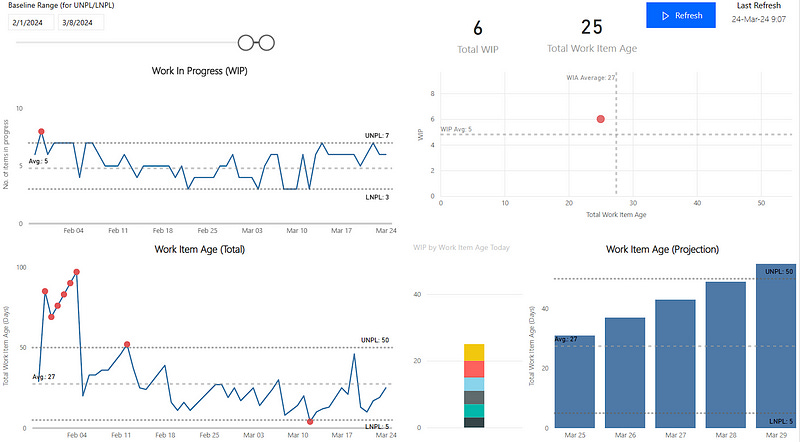
The data is updated automatically whenever an item either enters or leaves our workflow, so we can make instant decisions on whether more work shall be made available for the team to pull in or not.
If you are using Power BI and Azure DevOps, you can get the template for the dashboard via GitHub.
GitHub — huserben/Total-Work-Item-Age-Projection-Power-BI-Template: Power BI Template to visualize…
Power BI Template to visualize the total work item age (X-Chart) as well as a projection of the Total Work Item Age…github.com
Using the WIP x TWIA Chart for WIP Control
After thinking about the charts with the quadrants, we started using it in practice. We’ve tried two different approaches so far, and will quickly share our experience behind it.
In general, we never want to be “on the right” side of the chart. That means TWIA is too high and we should focus on finding ways to close the oldest items as soon as possible. There are always exceptions that might explain why we are there, but in general being “on the right” means that we should not add new work.
Aim for Below Average TWIA and WIP
What we tried at first was to go for below-average TWIA and WIP. That meant that we only added new items to the process if we were in the lower left quadrant. We tried this for about 4 weeks, and we saw a decrease in TWIA and Cycle Time. However, our Throughput also reduced, which was an indication that with this approach the system was not working at capacity:

We dive deeper into the data in a follow-up post, stay tuned for this.
After we analyzed the results, we switched to another way of controlling WIP.
Aim for Above Average WIP and Below Average TWIA
The next approach we used was that we aimed to be (and stay) in the upper left quadrant. That means that as long as we would not exceed the Upper Natural Process Limit of the WIP and we would stay below the average of TWIA, we would consider adding new items. We would look at the Total Age for the next few days to see if it makes sense to add more work (for example if we’re about to go above average soon or if we would drop significantly because one older item is about to be done).

The results were satisfying with this approach, as we managed to keep Total Age and Cycle Time low, but as WIP increased, our Throughput did too.
Little’s Law in Action
In our two experiments, one could see Little’s Law in action:
Average Cycle Time = Average Work In Progress / Average Throughput
In the first experiment, we lowered our WIP and paid more attention to age. This has led to a lower Throughput. When we adjusted our approach, we wanted to increase our Throughput again:
Average Throughput = Average Work In Progress / Average Cycle Time
We therefore needed to either lower Cycle Time even more or increase WIP while keeping our Cycle Time at the same level. By aiming for having WIP in our “upper left” quadrant, we managed exactly this.
Knowing the theory behind the measures of flow and how they are connected can be very helpful in adapting your ways of working. And while there are assumptions to Little’s Law and you most likely won’t see the effect immediately, Little’s Law is a very good guide for potential adjustments to your workflow and practices.
… changes will manifest themselves in ways such that
the relationship among all three metrics will still obey that law. But
what it does not say is that you can deterministically predict what
those changes will be. — Appendix A, The Kanban Pocket Guide
Should I now change my approach to Control WIP?
One driver of this post was that WIP limits are not the only way to control WIP, and I hope you can see this now.
If you have a decent process established with your teams and would like to try this as an experiment, by all means, go for it. However, if you are just starting, you might be better off by starting simpler. Using system-wide WIP limits worked well for us (and we would recommend them over column-based ones).
Our approach is more advanced, and you should have some basic understanding of how Flow and Process Behavior Charts, which might be overwhelming if you and/or your team are completely new to this. In any case, feel free to reach out if you want to learn more.
And even if you have a concrete problem at hand, there are probably many ways to address it. To quote Dan Vacanti again regarding our initial example of having aging items while the system-wide limit in place that signals we should start new work:
…if you have old items but are under your WIP limit, then your WIP limit is probably too high. My point is that you could just as easily solve these problems with WIP limits as well as total age. — Dan Vacanti via ProKanban.org Slack
Conclusion
While we don’t have months of data yet, we can see that our new way of controlling WIP using the WIP x TWIA chart and aiming to stay above average in WIP and below Average for Total Age is working well. It gives us signals including more than “just” Work in Progress and the increased Throughput with lower Cycle Times suggests that it’s a good way forward for us.
If you happen to try this out or have an alternative way of controlling WIP in your workflow, let us know, we are curious to learn more!
Lastly, if you are interested in the data we’ve collected, stay tuned for part 2 of this post where we dive deeper into that.
About Us
We are Lorenzo (Product Owner), and Benji (Scrum Master), and have been experimenting with various ways of working for years together with our teams at Hitachi Energy. Feel free to connect with Lorenzo and me in case you want to discuss more details.
Credits
Most of the charts you can see were done using Nick Brown’s Power BI templates FlowViz and Process-Behaviour-Chart. Without Nick’s great work, which he shares for free as open-source projects on GitHub, we would not manage to capture all the data that is needed for such an analysis. If you work with Power BI, you should certainly check out Nick’s GitHub as well as his FlowViz course.
Course announcement: FlowViz Fundamentals — Nicolas Brown
FlowViz is a free data visualisation template for Power BI that allows you to better visualize flow metrics from the…www.nicolasbrown.co.uk
GitHub — nbrown02/Process-Behaviour-Chart: A Power BI template that generates a Process Behaviour…
A Power BI template that generates a Process Behaviour Chart (PBC) to visualize the variability and predictablity agile…github.com
Thanks go out also to all the people in the ProKanban.or Slack Channel who were involved in the discussion about this approach. After having “one of those crazy ideas” it helped to write it down and have a place to discuss it within the community. If you are not yet on the Slack channel, go for it now. Special thanks to James Farley for the extended review and feedback on the first version of this post — you rock!
Last but not least, we would not have considered changing our approach without the works of Daniel Vacanti (especially after reading his last book) and Prateek Singh. If you haven’t read their books and checked out DrunkAgile on YouTube, make sure to do this right away.
Actionable Agile Metrics for Predictability: Advanced T…
Read reviews from the world’s largest community for readers. The only reason to collect data is to take action. We take…www.goodreads.com
Scaling Simplified: A Practitioner’s Guide to Scaling F…
Read reviews from the world’s largest community for readers. If you are a large organization that has seen the benefits…www.goodreads.com
Drunk Agile
Share your videos with friends, family, and the worldwww.youtube.com