
How Lighthouse changed the way I work
A daily routine I didn't plan — and now can't imagine working without

I’ll be honest with you: I didn’t set out to build a daily habit around Lighthouse. It just sort of happened.
What started as occasional check-ins turned into the first thing I do every morning. Open Lighthouse, click through the teams, see what’s going on.
No agenda, no checklist, just looking. And yet, this simple routine has fundamentally changed how I work with teams and stakeholders.
In this post, I’d like to walk you through what that actually looks like in practice. Not the theory, not the marketing pitch but rather how I use the tool in my daily work and why it has become indispensable to me.
The Morning Routine
My day starts with Lighthouse open in the browser. I browse through teams and not because someone asked me to, but because it gives me a feel for what’s happening across the system.
I look at work in progress. I check cycle times. I look at the started versus closed work items to see how a team is currently doing. Is it closing more than it’s starting? Or is it the other way around?
These are all pointers I can give to the people I work with. Not answers, but pointers.
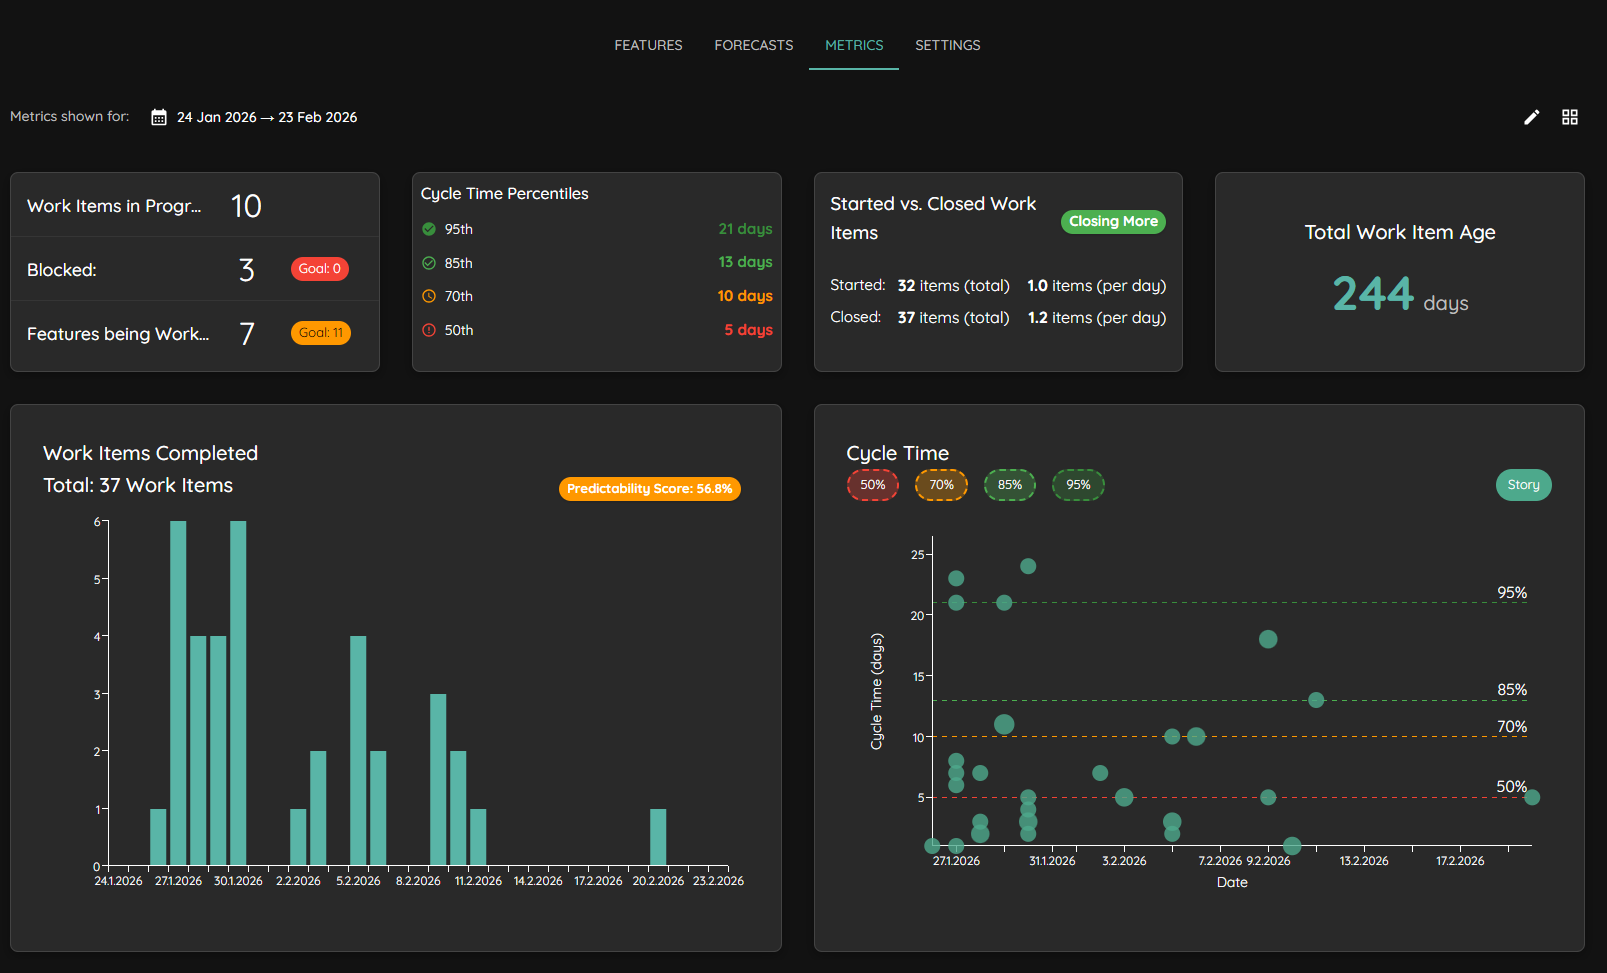
And then of course I’m always on the lookout: Is there anything in the system I can see that the team might not have noticed yet? Something worth a conversation?
This part of the routine operates on what I’d call Flight Level 1, the operational level. What is going on inside a specific team, right now?
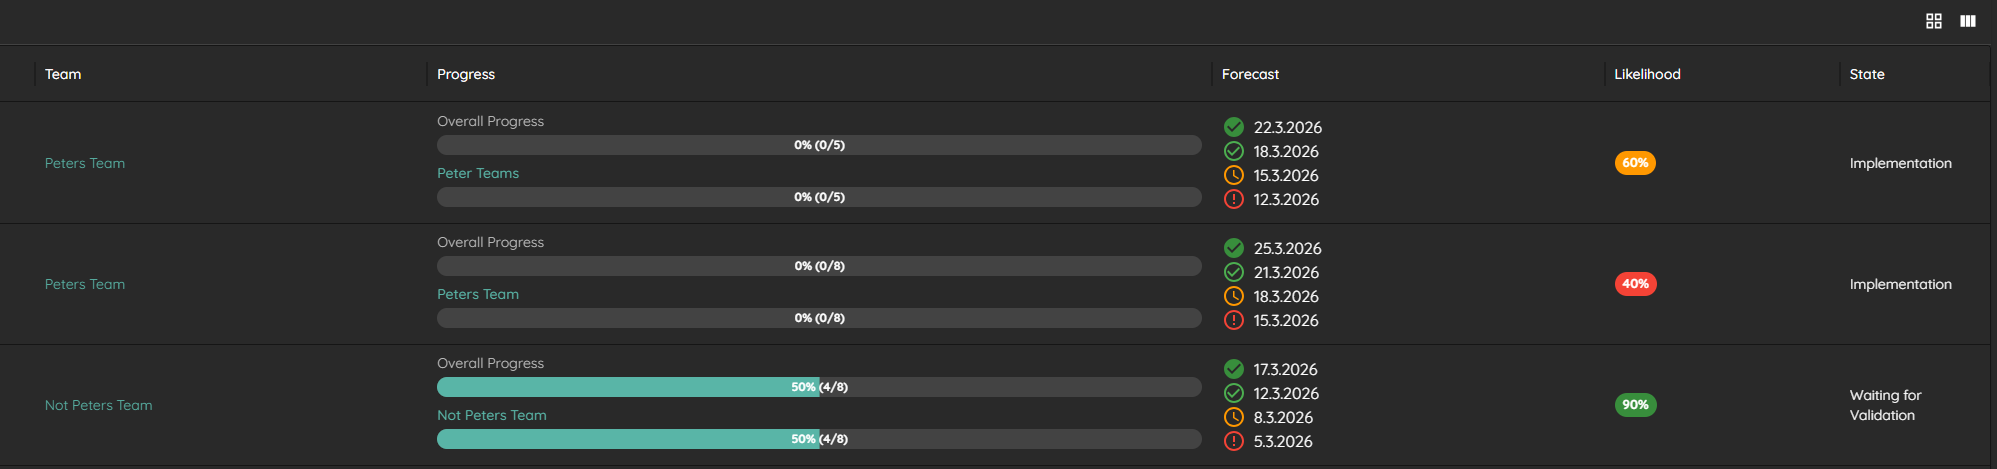
For example, at the moment I’m looking at a team where the work in progress was drastically reduced, which I think is a very good thing in this case.
Zooming Out: Initiatives and Aging
But I don’t stay at the team level. I might zoom out and look at specific deliveries on an initiative level and with that move more into a Flight Level 2 perspective.
First, I look at the initiatives themselves.
Which ones are aging?
How much are they aging?
Similarly to the team level: how many initiatives are we starting versus how many are we closing? And obviously, how many do we have in progress at the same time?
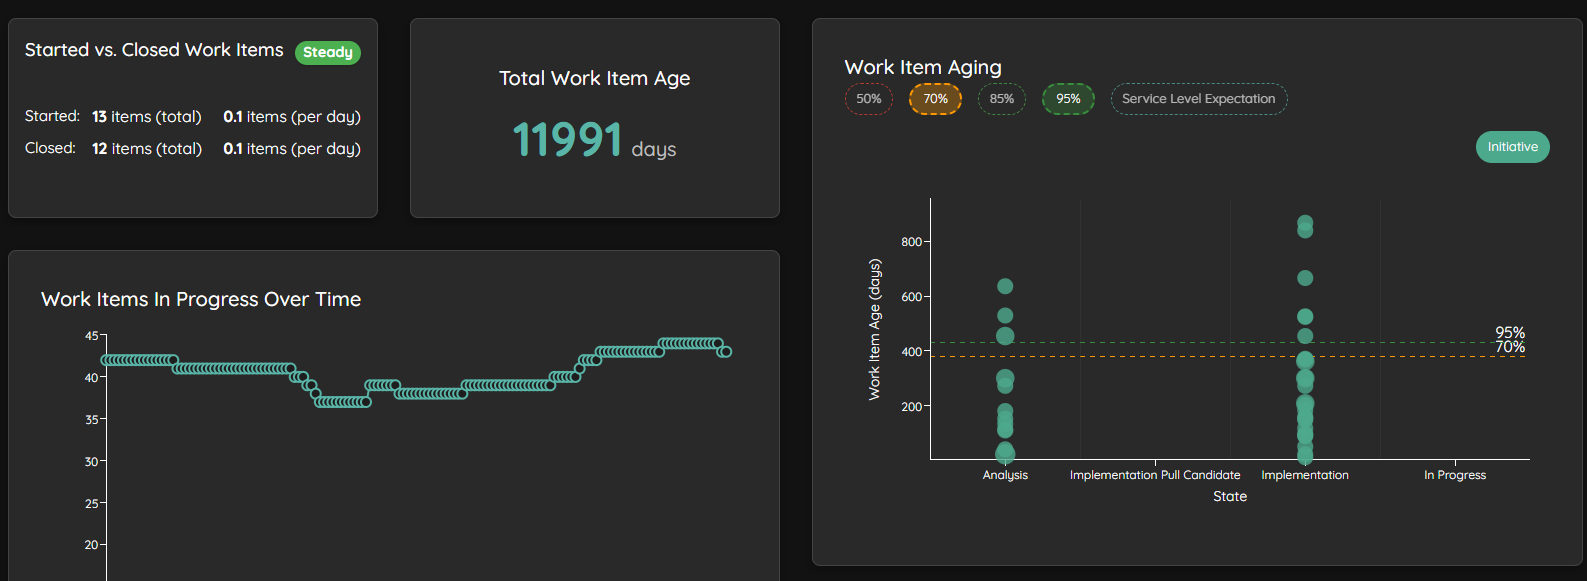
Lighthouse also gives you a very good indication with the total work item age, which can be an indicator for how stable our system is.
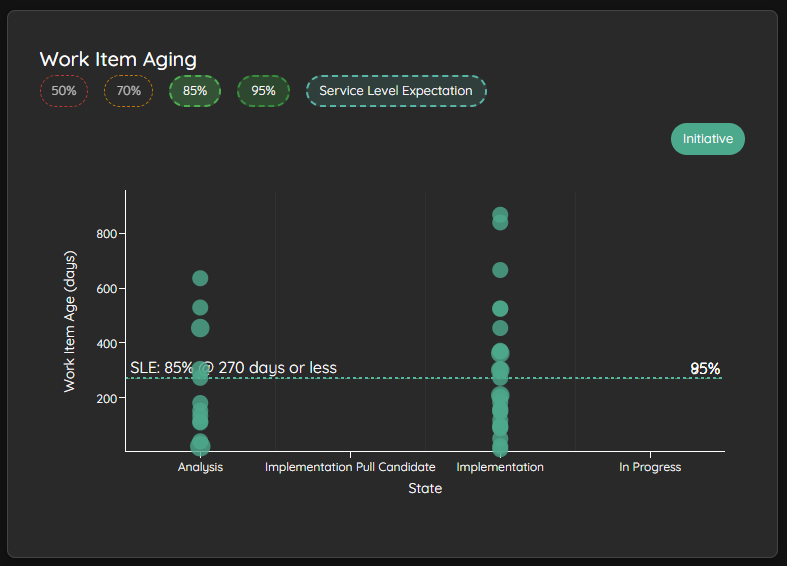
And then I go into the details. Depending on the service level expectation, I might filter for the initiatives that are close to it or the ones that are already above it.
Is there anything we can do? Is there any support that could be needed?
The intent is always the same: start finishing, stop starting. Which sounds so easy but is incredibly hard to achieve depending on the complexity of your system and organization.
Forecasting: From Gut Feeling to Probability
Another thing I use Lighthouse for and this might be the part that changed my work the most is specific forecasts.
A product owner asks me: “Can you help to forecast when this feature will be done?” Instead of guessing or pulling a date out of thin air or asking some silly questions, I open Lighthouse and look at the forecast. I might play around with it a little. Check the team’s metrics. If more teams are involved, I look at those too.
The question I always like ask myself: does this make sense?
But it goes further than individual features. It might be something for a release where I know a date is planned. Maybe the release even has dependencies, some companies use gates.
With Lighthouse, I can set up a delivery, set the delivery date, and Lighthouse will give me a forecast of the probability of all that is planned actually happening. It tells me whether my date is something we could actually reach or something that might be a bit difficult to reach.
This is just data. What we do with it is up to us.
But here’s where it gets really valuable: I go through the list and see which epics, features, whatever you call them in your context have a very low probability of being completed until that date. And I see this early. Not on the due date itself but weeks before.
This sparks useful conversations with the responsible people. What does it mean for us? Do we need to reduce scope? Can we remove the epic? Are there dependencies? Are there other things we can deprioritize?
The idea is to have the first conversations weeks before the due date when there actually is still time to discuss, converge, and actually do something about it.
Rather than finding out on date X that we missed it and say “Bad Luck - will for sure work out next time”
And the nice thing is: there is nothing you have to do manually. Lighthouse updates these forecasts on a regular basis. Even if you just sit down every Monday and check how things are progressing, whether anything changed, there is nothing you have to do except clicking into the right window.
That takes a lot of complexity out of it. I don’t have to sit down and calculate anything myself which apparently is a fear for a lot of people hearing about Monte Carlo Simulations.
The Power of Specifics
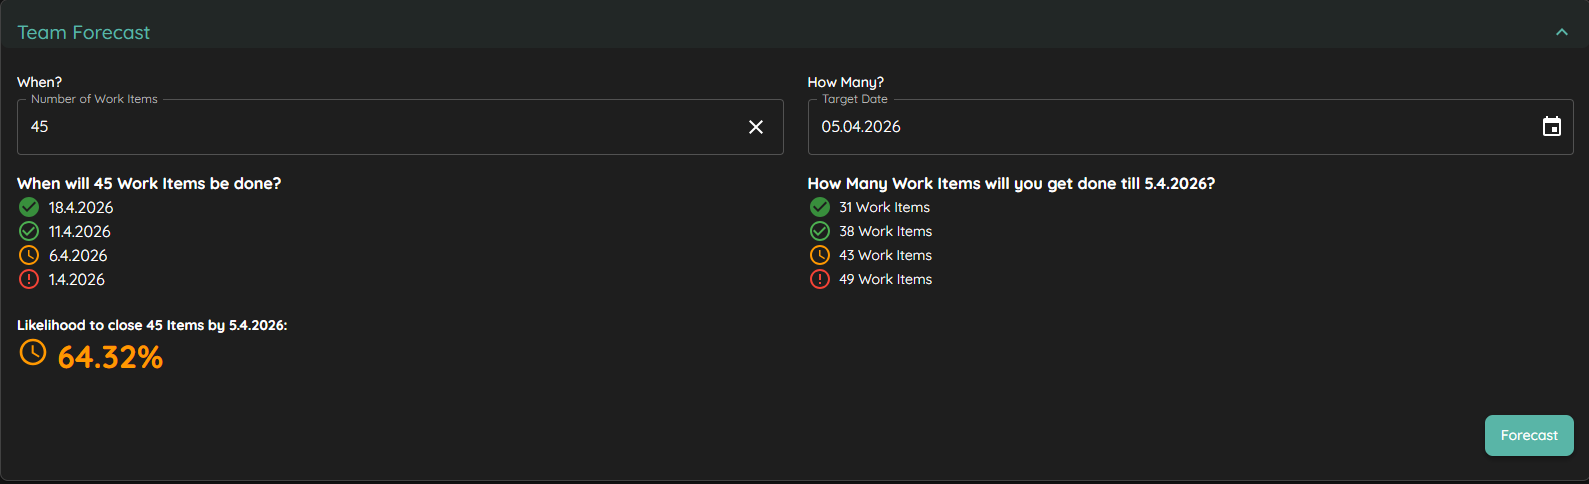
Of course, it also works the other way around. If there is a need for a very specific forecast say, we have one epic and we know we need to finish it by the 8th of March — Lighthouse can tell me how probable that is.
I go into the tool and ask:
How probable is it that we will finish 25 items until the 8th of March? Lighthouse tells me the likelihood is less than 7%. Which is not a lot.
But it doesn’t stop there. It also tells me: based on what we have at the moment, the 85th percentile suggests the 23th of March. And on the other hand, if the 8th of March is the date that isn’t movable, it tells me how many items I can realistically expect:
5,8,11 or 14 depending on my risk appetite.
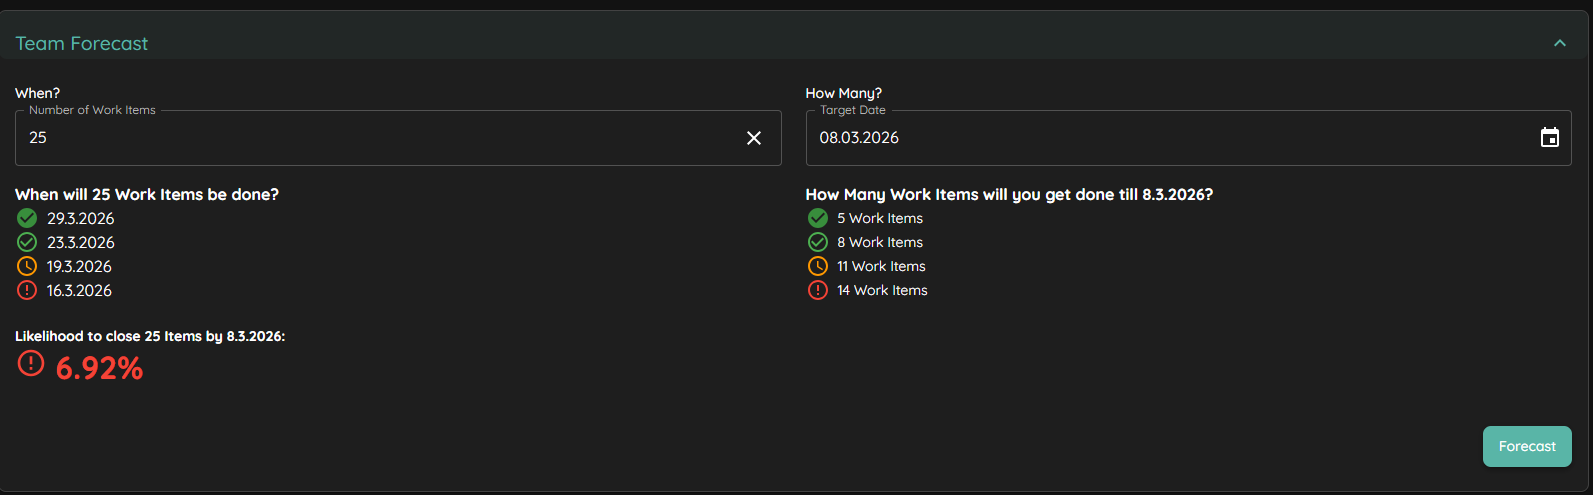
That’s a conversation I can have with a stakeholder. Not “we’ll try our best” but “here is what the data says, and here are our options.”
Building Trust: Forecast Backtesting
One of the great things we’ve introduced recently is forecast backtesting.
And to me, this is really a feature that I like to use to give people confidence.
Because still, my experience is that forecasting feels spooky and sci-fi to a lot of people. It’s just not what we’re used to. So a feature that lets you prove the forecast is trustworthy? That’s incredibly valuable and hopefully gives organizations trust in this.
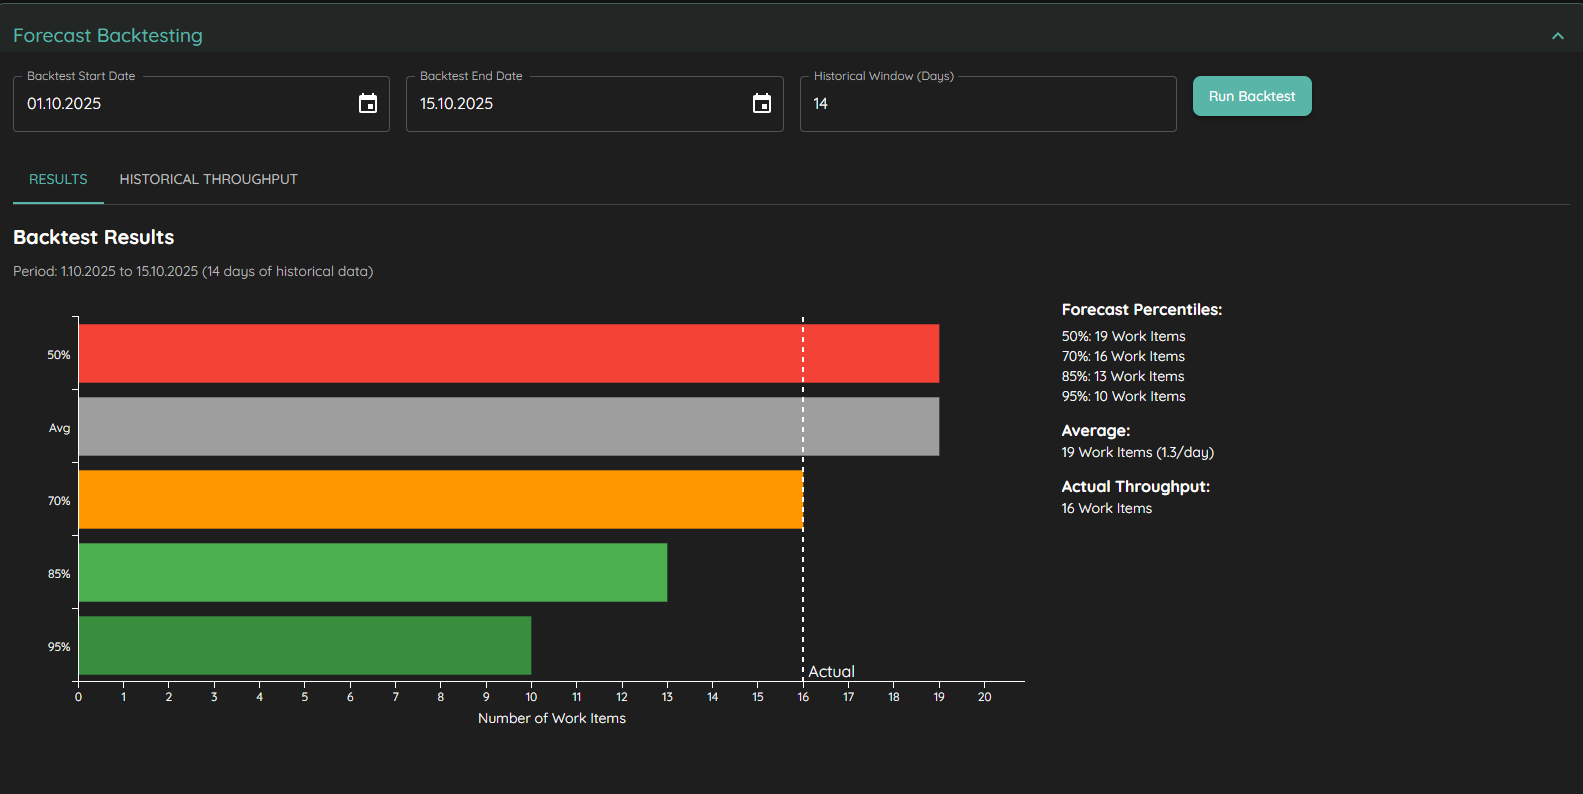
For example, I ran a backtest recently for a two-week time period in October. The 85th percentile said 12 work items would be finished. The actual throughput was 16 work items. That gives me confidence, it’s not completely off. And I can also play around with the historical windows. Change it to 14 days and suddenly we’re very close to the 70th percentile, which was 16 items.
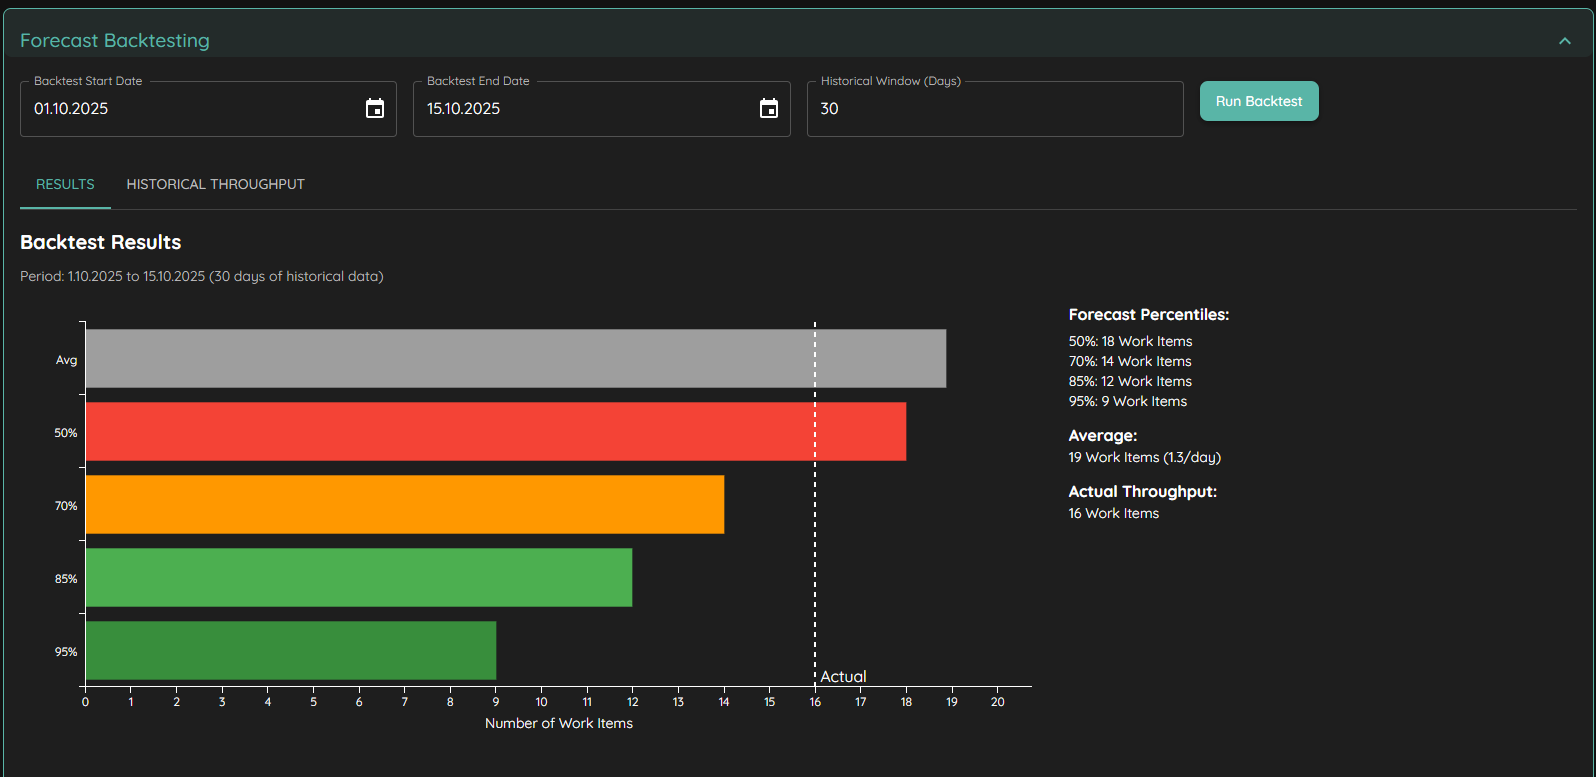
This proved to be very fruitful for building trust with the people I work with. It turns the abstract into something tangible and verifiable.
Monthly Reports and the Role of Data
I’ve also started using Lighthouse for monthly reports and not in a sense where I do a reporting and people are scared of me sending the report, but rather I go through the data and compile suggestions, observations on what can be done, where patterns are emerging, where something might need attention.
But here’s the thing I always emphasize: Lighthouse provides you the data. The context, the real, messy, human context lives in the teams and the people working with it. They will always have more information than any dashboard can show.
I like to say: the data is a pointer. A pointer to ask: Is this accurate? Does it reflect the way we work at the moment? Is there anything we can do?
And if we do change something, the data comes back and says: yes, it worked. Because we can see something moving.
Why This Matters: Evidence Over Gut Feeling
What I’ve experienced with teams is that they get genuinely enthusiastic whenever they see a change they made reflected in the data. It’s like a booster.
A lot of times when we change something in teams or on an organizational level, let’s not ignore the other flight levels here we trust our gut and say “yeah, it feels better.” And that’s a nice indicator. But I think it’s a lot stronger when we actually have evidence. When we can see that we’re moving more things through the system. When we can see that cycle time came down because we did something specific.
Same on a Flight Level 2 when starting to right-size initiatives and you can see that cycle time is actually going down, thats a big booster on a different level.
We get feedback quicker, features out to customers faster, and therefore learn sooner.
This is something that is very motivating. We all know that change is difficult and tiring. But having something solid, actual proof that what you did made a difference? That keeps people going.
The Short Version
If I had to summarize it: there is not a single day where I’m not using Lighthouse. There is always something to find. Whether it’s a team whose WIP just dropped, an initiative that’s aging beyond its service level, a forecast that needs updating, or a backtest that helps me build trust with a stakeholder.
You don’t need a lot of data. Installation is easy.
It’s a tool that changed how I have conversations. Not because it gives me answers, but because it gives me the right questions.
And in my experience, that’s worth more.