

Doing a forecast for a single team is one thing. As soon as more than one team is involved, it gets trickier. Not the simulation itself, but the interpretation of the results. There’s a very natural way to combine multiple teams’ forecasts that feels right, but is wrong in a direction that always flatters you.
In this post, I’ll walk through the pitfalls and show you how to forecast the common multi-team scenarios by hand, in a spreadsheet.
Intro to Monte Carlo Simulations (MCS)
If you are not familiar with using Monte Carlo Simulations in Software Engineering to forecast work, here is a very brief explanation. In a nutshell, using MCS to predict when a set of items will be done works like this:
Establish how many items are left: For example: 18
Define the historical window you want to look at: For example: the last 90 days
Sample a day at random from this throughput and check how many items were closed that day: For example: On day 86, we closed 2 items
Remove that amount from the total and increase the counter for how many days you have samples: For example: 18 - 2 leaves us 16; this was the first day we sampled
Repeat 3 and 4 until you have <= 0 remaining items and note down your result: For example: after the 23rd day of sampling, we were at 0 remaining items
Start fresh and run through steps 3-5 for another 9999 times
Plot the results in a histogram and read off the percentiles
If this is not clear to you, please have a look at my earlier post. It provides an intro and will let you do it yourself within a spreadsheet. Everything below assumes you do have an understanding of MCS.
An Introduction and Step-by-Step Guide to Monte Carlo Simulations

Since we started using Monte Carlo Simulations for forecasting instead of estimations with teams we work with, we’ve gotten several questions about how it works and more importantly what data is needed to run them.
How Lighthouse Forecasts
This post is based on the forecasting we implemented in Lighthouse, our flow metrics and forecasting tool. Thus, it’s worth mentioning here how Lighthouse is forecasting features. There is its own dedicated post about this, but I will quickly share the gist.
Lighthouse will run one MCS for each Team. For this, it will gather all the Features that a team is contributing towards, put them in a sequence based on the unique ranking, and then check how many items are left per Feature.
So if you have a team that contributes to 3 Features, with: 7, 9, and 3 stories, there will be one MCS that answers: When will 19 stories (7+9+3) be done?
Once the first 7 stories are done, the first feature will be marked as done in this trial; when the next 9 stories are done, Feature 2 is marked as done.
How Lighthouse Forecasts

This post is an excerpt from the Lighthouse Documentation and shows how Lighthouse uses Monte Carlo Simulations to forecast. It helps to explain how certain things work as they do in the tool.
If we have a Feature where two teams contribute, it will store when the first team with their work is done and when the second team with theirs is done. So for a single feature, there may be more than one “result” histogram.
Note that we will *not* talk about Feature WIP (what if I work on more than one feature in parallel?) nor Dependencies (what if I can only start the work on Feature 3 once Feature 2 is done?).
These are relevant questions, but would blow up this post too much and ultimately will not be relevant, as the two questions will affect the forecast results, but not how we handle multiple teams.
What Makes Multi-Team Forecasting Tricky
For simplicity, let’s assume we have just one Feature, where two teams contribute. Let’s further assume that both individual teams’ forecasts says: There is an 80% chance this feature is done in 16 days or less.
So when your stakeholder asks: When is my feature done, what will you answer?
Your first instinct might be:
In this case, it’s an 80% chance to be done in 16 days or less. But I can see how it can get more tricky if we have different results for each team.
The good thing: It’s not more difficult if you have different results per team. The bad thing: The answer is wrong…let’s look at this with a different example.
Rolling Two Dice
Imagine you have two six-sided dice. Rolling a six with one die has a chance of 16.6% (1/6). Rolling a six with the second one also has this chance.
But your chance of rolling two sixes will not be 16.6%, because two “independent events” must happen. Once for the first die, then again for the second. The chance that this happens is much lower; in fact, it’s below 3%. It’s both individual probabilities combined:
We can also visualize this. With two dice, we have all these potential outcomes:

And that’s why multi-team forecasts are trickier than for single teams. If you read my step-by-step intro for single-team forecasts, you know that all you need for MCS is basic maths, meaning adding and subtracting. For multiple teams, we’re entering the area of multiplication and division! But don’t worry, it sounds scarier than it is…
One might also think:
Maybe I just take the “worse” of the two results, so whichever team is slower, then I get around the multiplication
I get that you don’t like maths, but this won’t work. Let’s keep with the dice example: Let’s say you have one six-sided die and one 20-sided die. You would like to roll a 4 on the D6 and a 12 on the D20.
Your individual chances are 1/6 for the D6 and 1/20 for the D20. If we go with the approach of taking the “worse” forecast, your answer would be:
The chance is 1/20 (or 5%).
Now let’s say you take your D20 and actually roll a 12, neat! Against the odds, you managed. However, you still need to roll the four on the D6. So naturally, just “getting one out of two right”, even if it’s the lower chance, will not be good enough. It’s way too optimistic. And the more teams you have, the worse it gets...
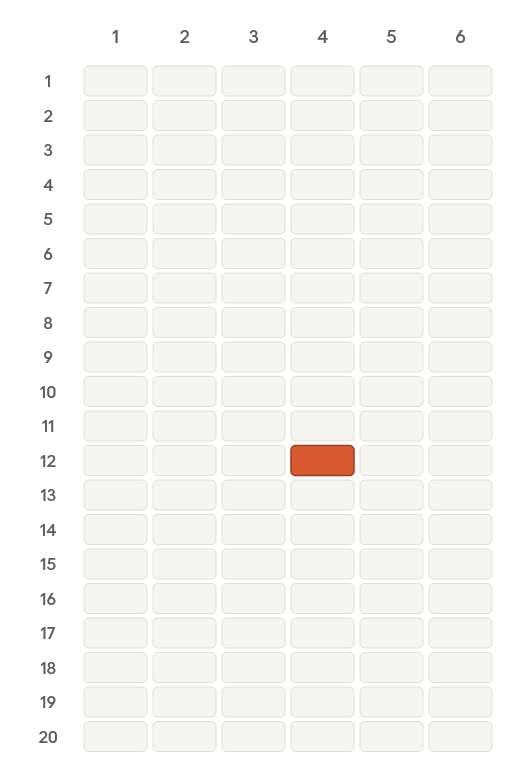
In case you were wondering, the chance to roll a 4 and a 12 is ~0.8%:
Visualized, you can see the chance is not that high:
How Bad Is It, Really?
So yeah, all fun and games with your dice, but what about my problem with the teams and their forecasts…is it really that bad and does this matter at all?
It does. We checked a real team’s 90-day throughput through the simulation and asked what the date we’d report as “85% likely” is actually worth once other teams also have to be finished:
At five teams, a date you’d have announced as highly likely is closer to a coin flip, while simultaneously nobody slowed down. So getting the forecast right really matters. Let’s look at a more hands-on example.
Two teams, one Feature: “When is this Feature done?”
Let’s look at this with a concrete example. We have one feature and two teams. Both teams have different items in their backlog to deliver this respective feature.
We already ran the MCS for each Team, and ended up with these results:
*Note that the results are simplified; a real MCS would of course not end up with such nice numbers, but I don’t want to make the math harder for you =)
So the chance that each team delivers their part of the feature on day 5 is:
80% for Team A: 8’000 of 10’000 trials finished at day 5 or earlier
88% for Team B: 8’800 of 10’000 trials finished at day 5 or earlier
Combined, there is a 70.4% chance (0.8 * 0.88) that this is done by day 5. Fine, but I want to know what the 80% chance of finishing is...how do I get that?
To do this, we take a running total: for each day, add up everyone who's finished by that day or earlier, then divide by the total number of trials. So for day 2 and Team B it means:
Sum up 100 (day 1) + 2000 (day 2)
Divide by 10000 (Total Trials)
Result: 2100 / 10000 = 0.21 = 21%
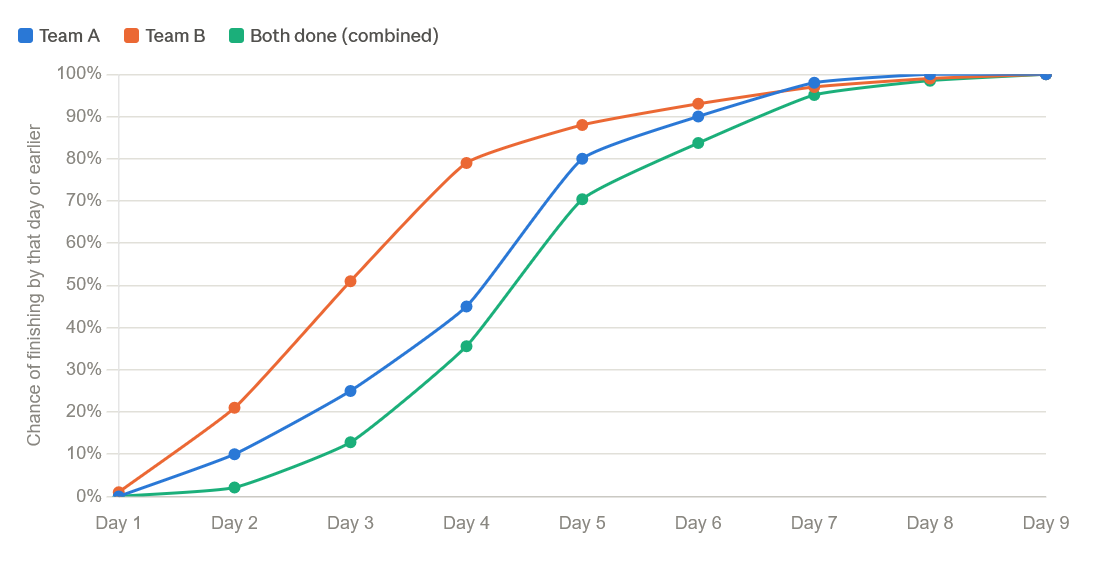
You can see here what I’ve explained above: On day 5, the teams are individually at 80% and 88% respectively. What we can do now is build a new table with the combined probability:
That’s the whole trick. One multiplication per row. Then you read off the day where the number reaches the certainty you like. In our example, 80% certainty at day 6. Here's the same three numbers as curves instead of a table:
Important is that you never just take the “older” date for any of the forecasts. You may be lucky, and it works out, but in reality it’s very often a later date. So let’s say we look for the day where we get to 85% certainty:
Team A has this after day 6 (90%)
Team B has this after day 5 (88%)
So the naïve way would be to take the max value, so it’s “day 6”. If we look at the combined table above, we realize: Only after day 7 at 95.06% do we have the combined probability >= 85%.
The combined curve is not built out of the individual teams’ answers; it’s built out of their full distributions. So don’t take the worst team’s 85% date and call it the Feature’s 85% date. Build the combined column first, then read your percentile off that.
More Teams & More Certainty = More Time
Now this was a “dummy” example, not with a lot of data, but I hope it made the point. Bottom line is: If you want certainty, it will take longer the more teams are involved, because you have more variables.
Nobody got slower, and yet we would end up a bit later. Sounds odd, but that's just how the maths works. At best, dates stay the same. Normally they will move back. There is nothing you can do about this.
At best has a concrete meaning here. A team that has already finished its share of the Feature is done on day one of every trial, so its whole column is 1.00. Remember third-grade math: Multiplying by 1.00 changes nothing. The same is true if only one team contributes: there is a single column, so nothing to multiply.
Combining never invents risk out of nowhere. It only surfaces risk that was already there and previously went unreported, which is why a feature that genuinely depends on one team is untouched, and a feature involving four teams moves the most.
Why not a single MCS?
You may wonder, why make it complicated and run one simulation per team?
Couldn’t we simply combine the Throughput of the teams and run one simulation?
It is tempting, but each team has its own pace, its own micro-processes and ways of working. With an MCS, we forecast the future by assuming it will look roughly like the past. And if you have two distinct teams, you are violating that assumption by putting them together.
But it’s not a big problem; you know the maths now, so don’t worry.
And Lighthouse has you covered, as we have all of this built-in:

So download it today and you can safely forget everything you know about multiplication!
Two Teams with their individual Features - When will all of this be done?
Let’s assume you have two teams and they work on their own individual features independently. Now a stakeholder wants to know whether we will be able to deliver the full feature set at a given date:
3 Features that Team A works on
5 Features that Team B works on
We can run the two distinct MCS per Team, which will give us a forecast for each of the 8 Features. But how do we now know what the probability is to get to a certain date?
You learned about multiplying the probabilities above, so your first instinct might be:
We get the eight individual probabilities and multiply them together.
If so, I get it. It certainly was my first instinct when I pondered this question. But it’s not quite right.
As we run an MCS per Team, we already assume that Team A works on feature 1, then feature 2, then feature 3 (assuming Feature WIP = 1 for simplicity). Naturally, feature 3 will be the one that will be delivered last, taking into account the other work that happened before.
So the features of a Team are not independent, and if we were to multiply the probabilities of them would charge a team twice, giving you a too pessimistic forecast.
What we should do instead is take each team’s worst number at the date we’re asking about, and multiply those across teams. Because the teams are independent of each other, even though a single team’s Features are not.
The date we’re asking about is what it is about, so it’s worth a clarification. You are not picking a permanently worst Feature per team and then reusing it forever. You are asking a specific question: will this be done by the 30th?
And for each team, you take the lowest answer among its Features. Move the target date and, in principle, a different Feature of that team can become the binding one. If you’re working sequentially, it will usually be whatever that team finishes last, and the two rules agree. But the per-date version is the one that always holds.
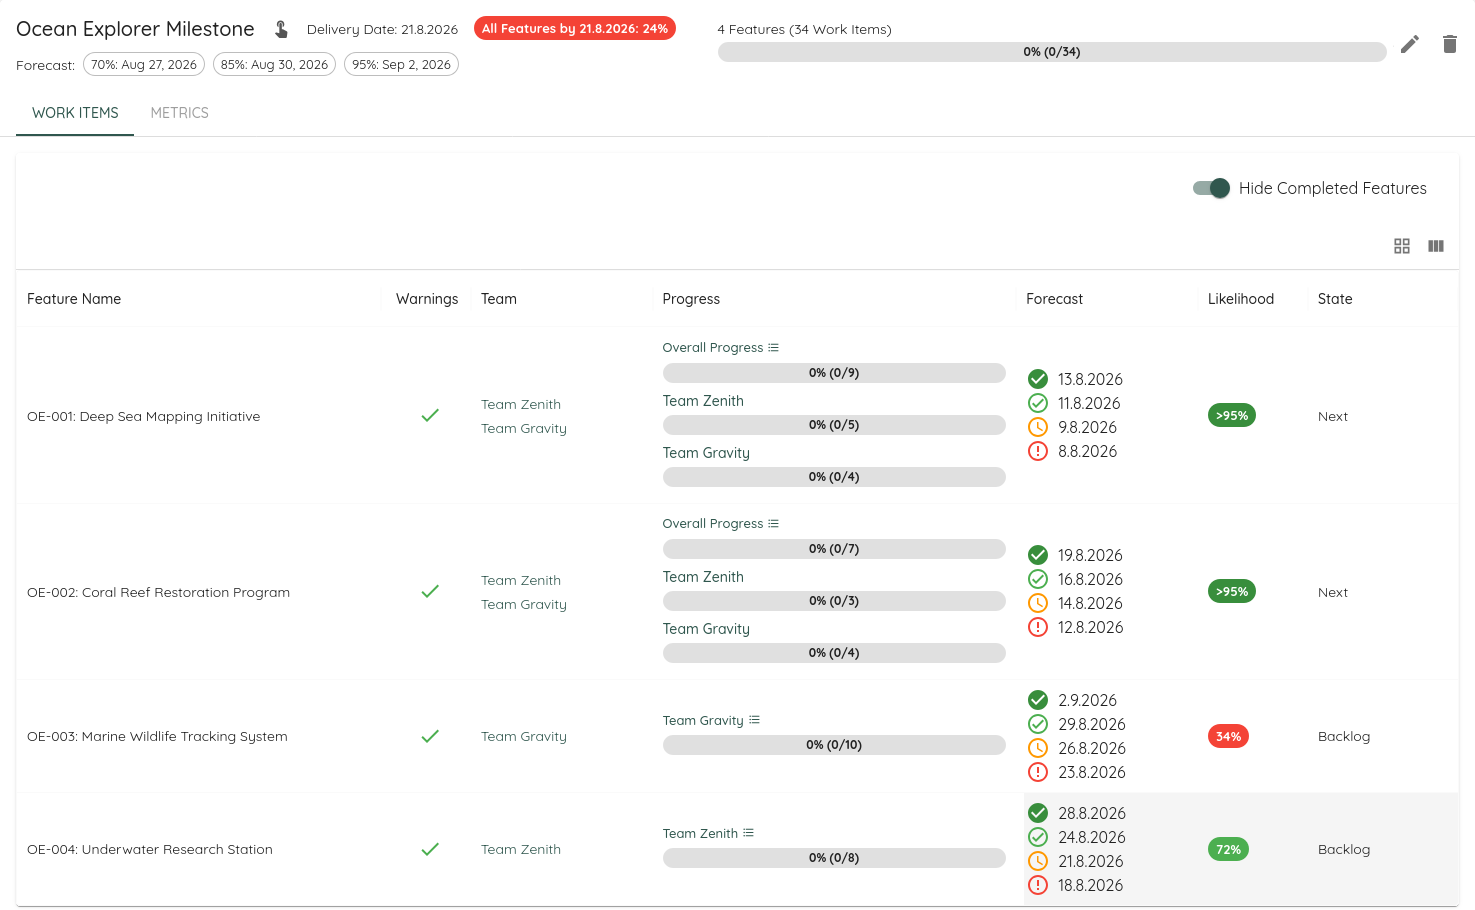
Taking a team’s worst feature is the most generous reading available: it assumes that when things go badly for that team, they go badly for all of its Features at once. That’s a reasonable approximation for a team working through one queue at one pace. If a team’s Features can go wrong independently of each other, the real number is somewhere below what you just calculated. It is never above it. So this is kind of a “best-case” scenario we are getting.
Combining Both Cases
While the best case is simply to have a single team with end-to-end responsibility and no dependencies, the reality looks different for many organizations. So you may have the case where you have multiple teams contributing to a single delivery, which also includes Features that share work across multiple teams.
Instead of telling you “Just get rid of dependencies” and charging you 2k for a two-day training (thanks for nothing), here is how you can calculate the forecast in this situation.
Let’s assume that we have a delivery with two Features and three involved Teams:
Checkout Feature: Team A and Team B both contribute.
Reporting Feature: Team B and Team C both contribute.
Team B is on both. That’s the interesting bit.
We want to know how likely it is to reach our target date, and we already have our individual team forecast for each Feature:
Now you take the “worst” row for each team:
Then you simply multiply each individual chance per Team:
The Delivery likelihood lands at 61%.
What may be confusing is that you will get different probabilities for the individual features and the overall delivery:
For the Checkout, you will get 72%:
While for the Reporting, you end at 81%:
The Delivery (61%) sits below its least likely Feature (72%). Correct and expected: you need both Features, so it can only get harder.
Now if you had multiplied the probabilities of the individual features, you would have ended up with a different result for your delivery:
That’s lower than the 61% we got, and it’s worth exploring where the extra pessimism comes from. Team B appears in that calculation twice: as 0.80 through Checkout, and as 0.95 through Reporting. The whole point of taking B’s worst feature was to keep the 0.80 and discard the 0.95, because B’s Checkout work is what governs B.
The gap between the right answer and the wrong one is the discarded 0.95. Same team, charged twice: once for the work that’s actually holding it up, and once more for work it will comfortably finish anyway.
A delivery is never more likely than its least likely feature. Sometimes it lands exactly on it, when one feature governs everything, and the rest have slack, or if only one team is involved, often below. Never above.
This also means that the forecasted date for the overall delivery may be later than any forecast for the individual features. Not a bug, just the maths again :)
Assumptions
Now for the above text, some assumptions were made. It’s important to understand that this must be true for the math to add up.
In a nutshell, we assumed that teams are working on their features independently:
We don’t share people across teams
We don’t wait on a handoff from another team before we can start our work
Teams can simply work on their “queue of features”, and they don’t delay each other
These are on top of the general assumptions of MCS, like the basic principle that you assume that your future looks roughly like your past.
Notice that the simplifications in this post lean in the same direction. Multiplying across teams assumes teams don’t get in each other’s way, and shared people or hand-offs make that worse, not better. So treat whatever number you calculate as a ceiling: the best you could hope for if all the assumptions hold.
As soon as you have more than one team, things get more complicated. Reality is often worse. To really profit, you should get rid of your dependencies, and while this is not easy, it should be the long-term ambition if you aim for predictability.
No 2k training pitch, but we do offer support for companies. Hands-on, grounded in data and our experience. Check out https://letpeople.work for more details.
Now What?
Hopefully I could elaborate a bit better on how you can use MCS when more than one team is involved (which is likely your reality if you are in a slightly bigger organization). You should know now that if that is the case, you cannot just look at individual forecasts, but instead have to look at a combination of the probabilities. And they will never be better than what you initially saw. This is the price you are paying for cross-team dependencies.
You may use those numbers to highlight the impact of your inter-team coupling to your leadership team. At the very least, you now have some data showing the (bad) impact this has on your deliveries! If you want more information, I can encourage you to read Prateek Singh’s take on the impact of dependencies.
Furthermore, Nick Brown elaborates in his new book Beyond Burnups: The different ways to forecast delivery (and when to use them) the things I covered today in great detail in case you want a deep(er)-dive.
Nick will talk about some topics from his book in our Meetup series Lighthouse Live. Check out our Meetup Page and sign up!

Apart from that, you should now understand that, while a bit more complicated than a simple MCS, a multi-team MCS is still spreadsheet arithmetic. We need some multiplication, but not much more. And the good thing is, all of this goodness is baked into Lighthouse. It’s open-source and free to use in the community edition, and will handle all forecasting for you: single team, multiple teams, deliveries.